Bollinger Bands are a volatility indicator: a middle line (moving average) and two bands above and below, whose distance depends on the standard deviation of price. The tool helps gauge the “range” of movement and look for bounces off the channel boundaries. This article covers how the bands are calculated, how to read touches of the upper and lower band, and how to combine them with RSI and Williams %R.
What Are Bollinger Bands
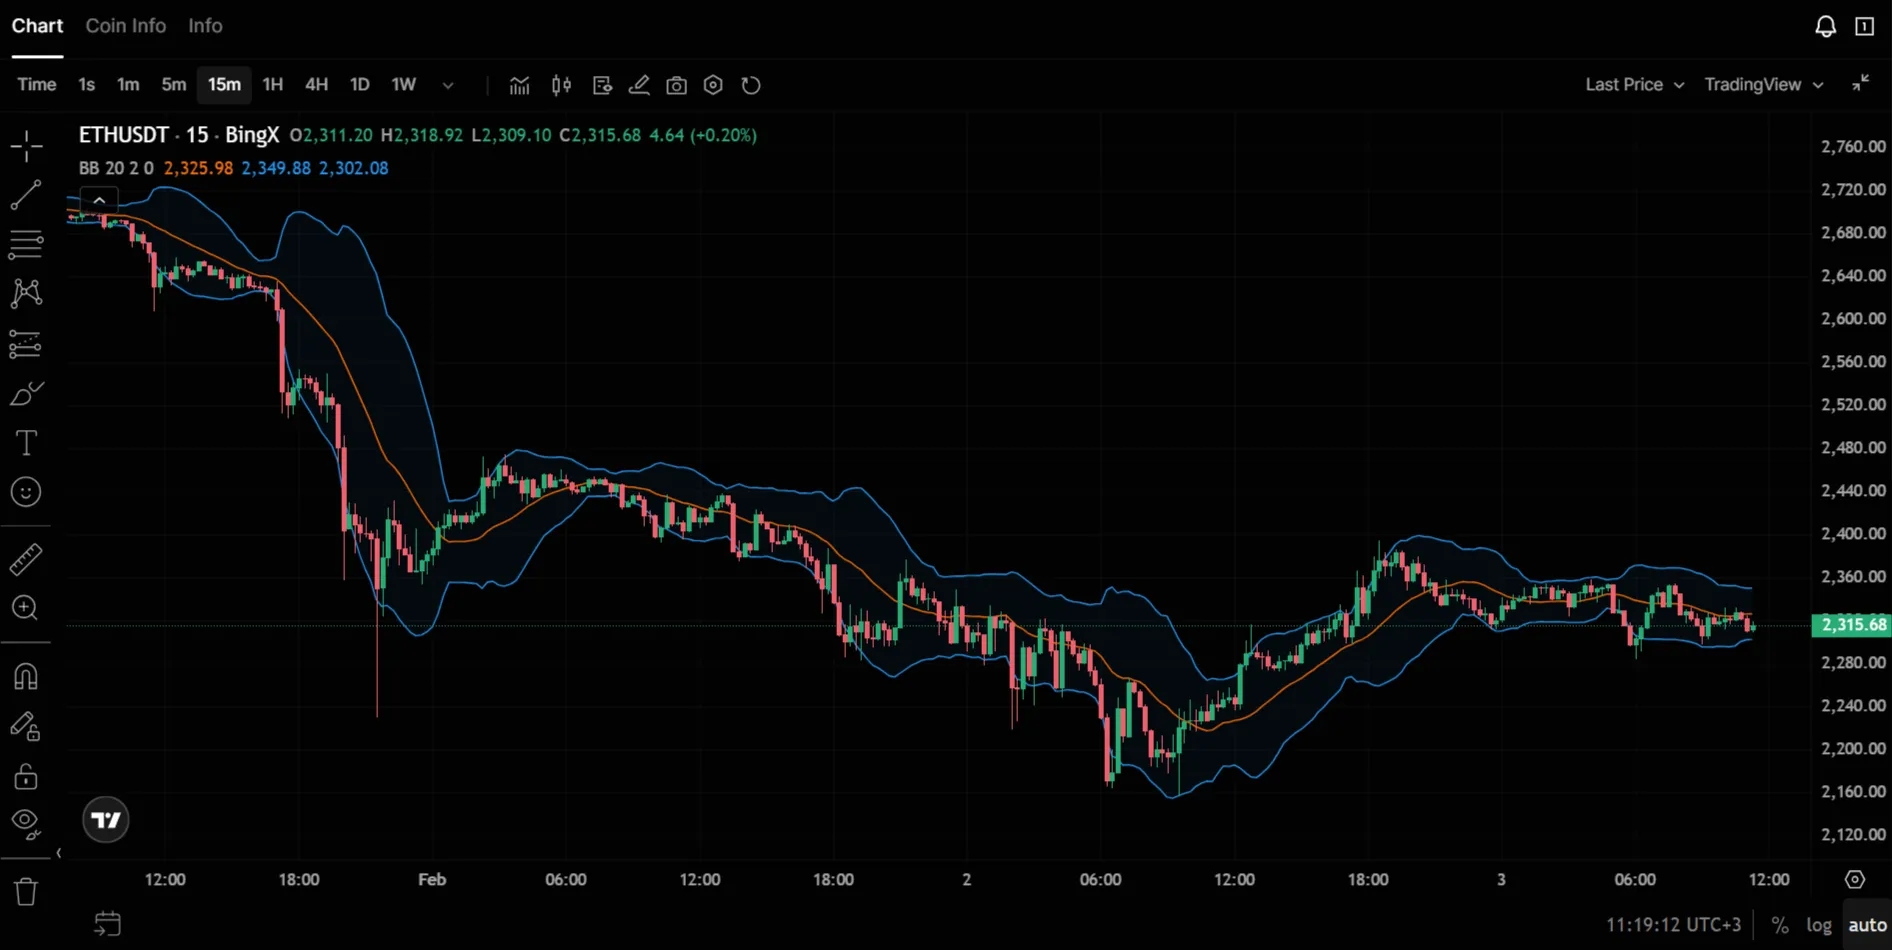
Bollinger Bands are an indicator made of three lines on the price chart. The middle line is a moving average (usually simple, SMA) over the chosen period. The upper and lower bands are drawn at a distance from the middle equal to a multiple of the standard deviation of price over the same period. So the bands widen when volatility rises and narrow when it falls.
The indicator was developed by John Bollinger in the 1980s. The idea is that price spends most of the time inside the bands, and a break or touch of the bands often precedes a reversal or correction. In technical analysis and trading signals articles, Bollinger Bands are grouped with volatility indicators such as ATR.
How Bollinger Bands Are Calculated
The calculation uses three values.
Middle band: simple moving average (SMA) of closing price over period N. Most often N = 20.
Standard deviation: computed over the same N candles from closing price. It shows how much price deviates from its average.
Upper and lower bands: middle line plus/minus (K × standard deviation). Usually K = 2. So upper band = SMA(20) + 2 × StdDev(20), lower = SMA(20) − 2 × StdDev(20).
Typical settings are 20 periods and multiplier 2. On lower timeframes a shorter period (e.g. 15) is sometimes used so the indicator reacts faster.
Interpretation: Overbought and Oversold Zones
A touch or break of the lower band is often read as oversold: price has moved down relative to its recent average. Many traders see this as a possible zone for an upward bounce. A touch of the upper band is overbought, with a possible correction down.
Important: in a strong trend, price can “walk the band” — stay near the upper boundary in an uptrend or the lower one in a downtrend. In those conditions, touching the band is not a standalone reversal signal. Confirmation is better sought from RSI or Williams %R and support/resistance levels.
Band squeeze: when the bands narrow sharply, volatility drops. A sharp move in one direction often follows. The bands do not show direction — only the possibility of a breakout. Direction is taken from trend or other indicators.
Buy and Sell Signals
A common way to use the bands:
- Potential buy: price touches or breaks the lower band, then reverses and closes back inside the bands. Confirmation can be RSI bouncing from oversold or Williams %R leaving the zone below −80.
- Potential sell: price touches or breaks the upper band, then reverses and closes back inside the bands. Confirmation is weakening momentum on RSI or %R.
One indicator can give false signals: e.g. price at the lower band but the trend still down. Combining Bollinger Bands with oscillators and, when useful, sideways trend strategies improves filtering.
Combining with Other Indicators
- Bollinger Bands + RSI: RSI shows overbought/oversold, the bands show extreme deviation of price from the average. Agreement (e.g. RSI < 30 and touch of lower band) increases the chance of a bounce.
- Bollinger Bands + Williams %R: as in the Williams %R article, %R and the bands together help spot when price has moved far from the average and the oscillator confirms the extreme.
- Bollinger Bands + volume: a volume spike on a bounce from the lower or upper band can confirm the strength of the reversal.
Avoid cluttering the chart: 2–3 indicators are usually enough. More on combinations in trading signals and backtests.
Use in Crypto Trading
The crypto market is highly volatile. Bands on crypto pairs often widen a lot on sharp moves and narrow in flat markets. Default 20 and 2 can work; when scalping on short timeframes a shorter period is sometimes used. It pays to test settings on history with backtests for the chosen asset and style.
In sideways markets, bounces off the band boundaries are clearer. In a trend, the bands can be used as zones of possible correction, with trade direction aligned to the trend.
For automated Bollinger Bands strategies, traders often use platforms like Veles — a popular service for running trading bots with customizable indicator settings.
Summary
- Bollinger Bands: middle line (SMA) and two bands at K × standard deviation. Default period 20, multiplier 2.
- Touch of lower band — possible oversold; upper — overbought. In a trend, price can ride the band.
- Band squeeze suggests a possible volatility spike; direction comes from trend or other indicators.
- Combining with RSI, Williams %R and, when needed, volume improves signal filtering.
FAQ
What settings for Bollinger Bands should I use?
Default — period 20, multiplier 2. For scalping on lower timeframes, reduce period to 10–15.
Why doesn’t price bounce off the band?
In a strong trend, price can “ride the band” for a long time. Touch alone is not a signal — confirmation from oscillators is needed.
What is band squeeze?
When bands narrow sharply — volatility is low. Often a sharp move follows. Direction is determined by trend.
Do Bollinger Bands give entry signals?
Not directly. It’s a volatility indicator, not direction. Use with RSI or Williams %R for confirmation.
Can I use them on crypto?
Yes, but with caution: crypto is more volatile, default settings may produce many false signals. Test on history.
Disclaimer
This blog is for informational purposes only. It does not constitute financial or investment advice.
Trading cryptocurrencies and other financial instruments involves high risk. You may lose all your funds.
The author is not responsible for any financial losses resulting from the use of information from this blog.