ROC (Rate of Change) is a momentum oscillator: it shows the percentage change in price over the chosen period. The zero line and values above and below it give an idea of acceleration or deceleration and possible reversals. This article covers how ROC is calculated, how to read levels and divergences, and how to combine it with RSI and Williams %R in the same family of oscillators.
What Is ROC (Rate of Change)
ROC (Rate of Change) is an indicator that measures the percentage change in price over N periods. It answers: by what percentage is the current price above or below the price N candles ago? ROC is built around a zero line: positive values mean price rose over the period, negative values mean it fell.
ROC is a momentum oscillator. It is not bounded to a fixed range, unlike RSI (0–100) or Williams %R (0…−100). The stronger the price move over N periods, the larger the absolute value of ROC. This helps gauge the strength and speed of movement and spot divergences — mismatches between price and ROC that often precede a reversal.
How ROC Is Calculated
ROC formula:
ROC = ((Current close − Close N periods ago) / Close N periods ago) × 100
So ROC is the percentage change in closing price over the last N candles. For example, with N = 12 and a 5% price rise over those 12 periods, ROC is about +5. With a 3% drop, ROC is about −3.
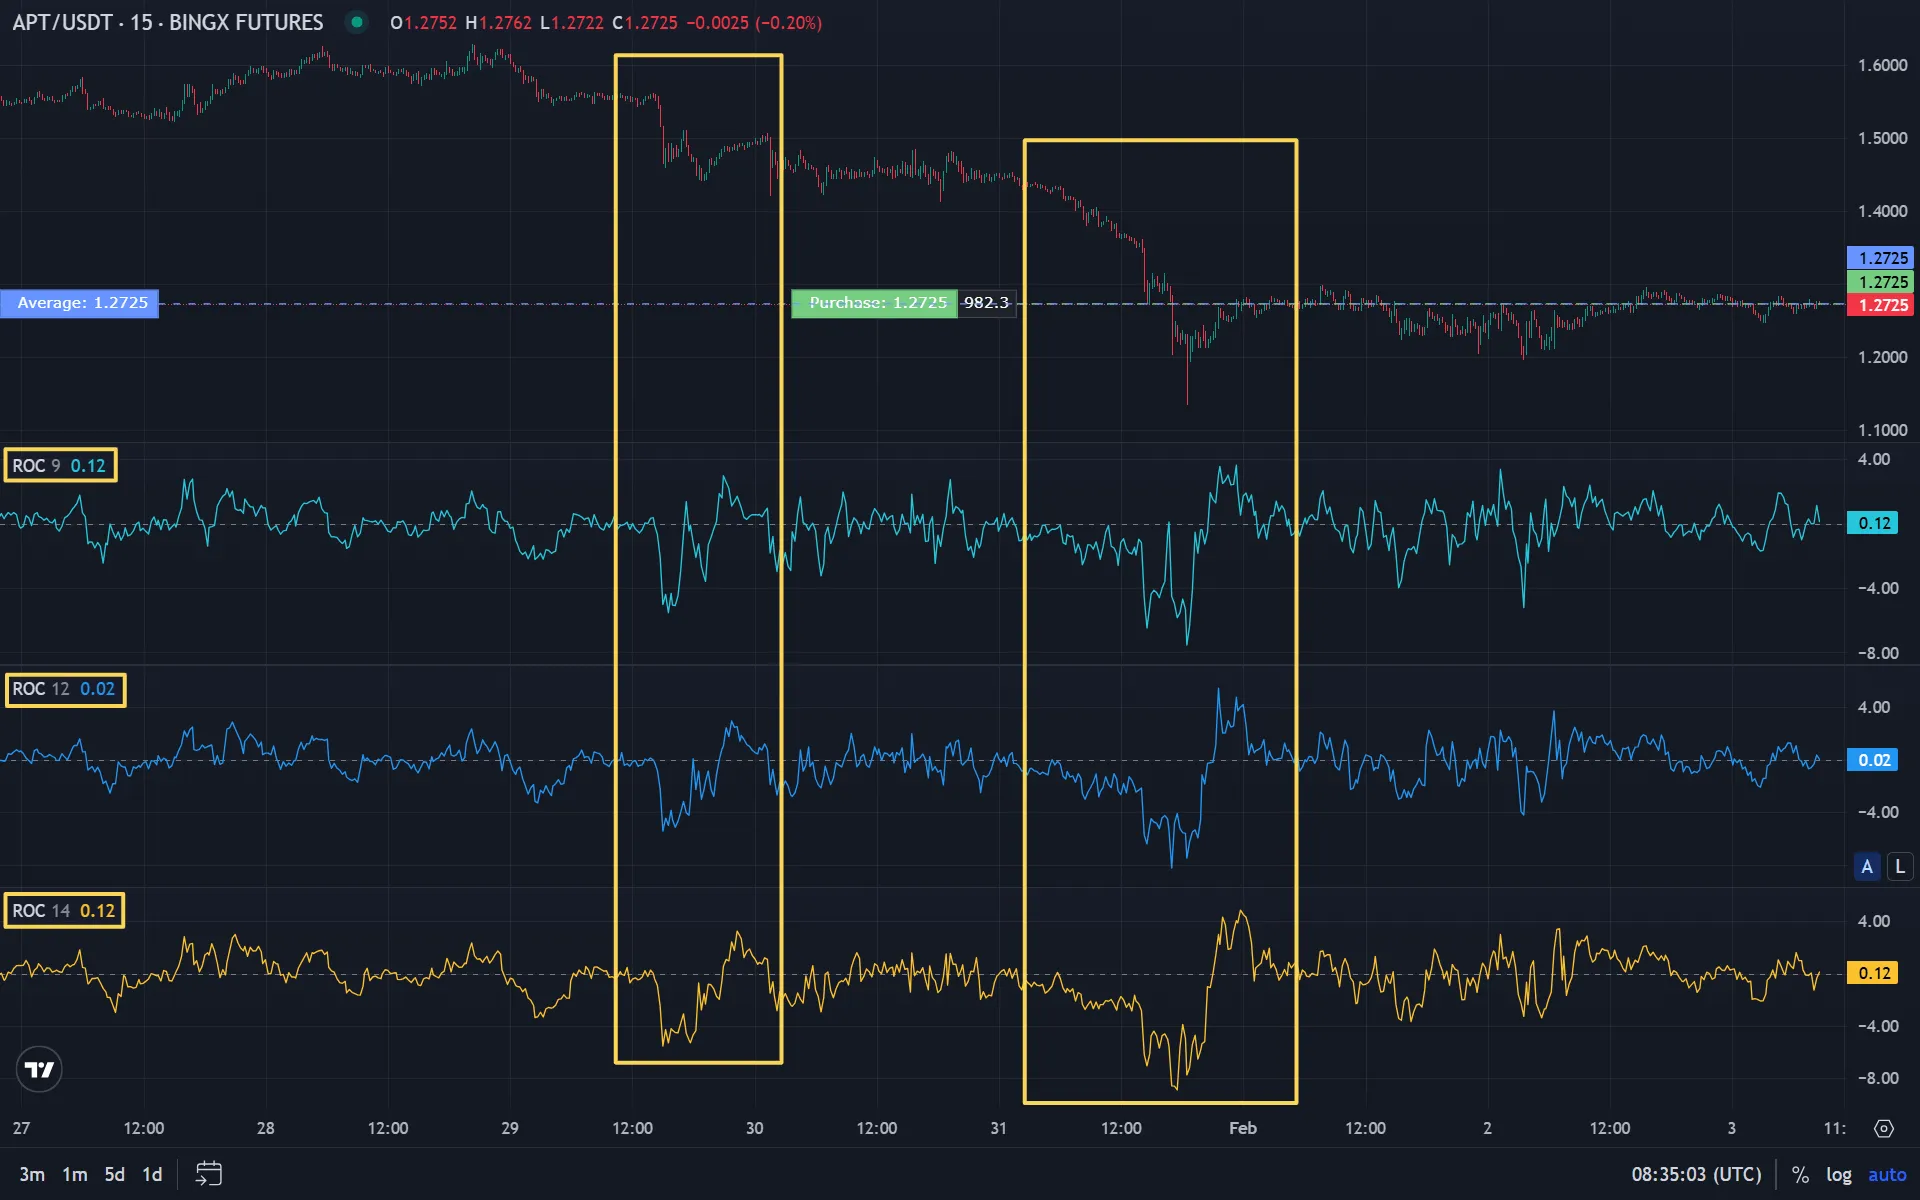
The period N is chosen by the trader. Common values are 9, 12 or 14 (as with RSI). A short period makes the indicator more sensitive with more signals; a long one makes it smoother. The choice depends on timeframe and trading style. It pays to test settings in backtests.
Interpretation: Levels and Divergences
Zero line: ROC above zero — price rose over the period; below zero — it fell. A cross of zero from below to above can be read as strengthening bullish momentum; from above to below as bearish. As with other oscillators, zero crosses alone often give many false signals, so they are better used with trend or other indicators.
Extreme values: a very high positive ROC means strong rise over N periods — possible overbought or exhaustion. A very low (strongly negative) ROC means strong decline — possible oversold. Specific levels (e.g. +5 and −5) depend on the asset and timeframe; they are tuned from history or backtests.
Divergence: when price makes a new high and ROC makes a lower high (bearish divergence), this can point to weakening upside momentum and a possible turn down. When price makes a new low and ROC makes a higher low (bullish divergence), downside momentum may be weakening. ROC divergences, like RSI divergences, are better confirmed by levels or volume.
ROC Combined with Other Oscillators
ROC, RSI and Williams %R are all momentum/oscillator tools but calculated differently. They can be used together for filtering:
- ROC + RSI: RSI shows overbought/oversold in a fixed range; ROC shows the speed of price change. Agreement (e.g. RSI > 70 and ROC in an extreme zone) can strengthen a correction signal.
- ROC + Williams %R: both react to price relative to the recent range; the combination helps filter some false exits from overbought/oversold zones.
- ROC + volume: Money Flow Index (MFI) uses volume; ROC uses price only. ROC gives the “speed” of price, MFI adds volume confirmation.
Avoid putting too many oscillators on the chart: 2–3 is usually enough. More on indicator combinations in trading signals.
Use in Crypto Trading
The crypto market is volatile, so ROC on crypto pairs often has large absolute values. On low timeframes ROC is very sensitive — many signals and noise; on higher ones (H4, D1) signals are rarer but often more meaningful. ROC divergences on crypto are easy to see during strong moves; they are worth checking together with false breakouts and levels.
Before using a ROC-based strategy in live trading, it is recommended to test it on history. How to do that is in what backtests are.
Summary
- ROC (Rate of Change) is the percentage change in price over N periods. Momentum oscillator around zero; positive — rise over the period, negative — fall.
- Formula: ((Current price − Price N periods ago) / Price N periods ago) × 100. Period often 9, 12 or 14.
- Zero crosses and extreme values give signals; ROC–price divergences can warn of a reversal.
- ROC works well with RSI, Williams %R and MFI; in crypto, settings and levels are best tuned by timeframe and backtests. For automated ROC strategies, traders often use platforms like Veles — a popular service for running trading bots.
FAQ
What ROC period to choose?
Standard — 12 or 14. For scalping on lower TFs — 5–9. For swing — 20–28.
ROC or RSI — which is better?
RSI is bounded 0–100, ROC is unbounded (shows percentage). ROC is faster, RSI is smoother. Use together.
How to use ROC divergences?
Bullish divergence — price makes new low, ROC higher. Bearish — new high, ROC lower. This is a reversal signal.
Why does ROC give false signals on crypto?
High volatility. Use with trend indicators and test on backtests.
Can I use ROC without other indicators?
Possible, but not recommended. ROC shows momentum, not direction. Combine with trend.
Disclaimer
This blog is for informational purposes only. It does not constitute financial or investment advice.
Trading cryptocurrencies and other financial instruments involves high risk. You may lose all your funds.
The author is not responsible for any financial losses resulting from the use of information from this blog.