Trading without records is like sailing without a map: you can move, but it’s unclear where and why. A trading journal helps you track trades, analyze mistakes, and monitor progress. In this article, we cover why you need a trading journal, how to maintain one, and what tools to use.
What is a Trading Journal
Trading Journal is a systematic record of all trades, decisions, and observations related to trading. It helps you rely on objective data for analysis rather than memory.
What to record in a journal:
- Date and time of the trade
- Asset, direction (long/short), volume
- Entry and exit prices
- Result (profit/loss)
- Reasons for entry and exit
- Emotional state
- Mistakes and takeaways
History: From Chalkboards to Digital Platforms
Trade tracking has existed as long as trading itself.
Trading Floor Era (19th — mid-20th century) — Chicago and New York stock exchanges used chalkboards to write quotes and trade volumes in real time. Traders kept paper journals, writing down each operation by hand. This required discipline and attention but gave a complete picture of the trading day.
Personal Computers (1980s — 2000s) — with the advent of PCs, traders switched to spreadsheets. Excel became the standard: automatic calculations, charts, analysis by periods.
Specialized Platforms (2010s — present) — today there are ready-made solutions:
- TraderMake.Money — automatic statistics collection via exchange APIs
- Edgewonk — advanced analytics and psychological metrics
- Tradervue — social platform for sharing trades
- Google Sheets / Excel — custom solutions
At Market Lab, we use TMM — you can track detailed public statistics of our test setups on one of our subaccounts.
 Fig. 1. TMM main page: overall statistics, deposit chart, metrics
Why You Need a Trading Journal
1. Error Analysis
Human memory is selective: we tend to remember successful trades and forget losing ones. A journal shows an objective picture:
- Which setups work better/worse
- Where risk management rules are broken
- What mistakes are repeated
Example: you notice that 70% of losses come from trades opened in the first 2 hours after the market wakes up. Conclusion: trade later, when volatility stabilizes.
2. Progress Tracking
A journal lets you see dynamics:
- Win rate (percentage of successful trades)
- Average profit and average loss
- Maximum drawdown
- Overall profitability by periods
Important: evaluate results not by individual trades, but by series (week, month, quarter).
3. Discipline Control
Recording each trade creates accountability. When you know you’ll have to write “broke stop-loss due to greed,” it’s harder to deviate from the plan.
4. Strategy Optimization
Accumulated data is the basis for backtests and fine-tuning:
- Which indicators give better signals
- Which timeframes suit your style
- How to adjust parameters when market conditions change
Journal Formats
Paper Journal
Pros:
- Information is better remembered when written by hand
- No distractions (notifications, internet)
- Works as psychological relief
Cons:
- No automatic calculations
- Hard to analyze large volumes of data
- Risk of loss or damage
Who it’s for: beginners forming discipline, traders with few trades per day.
Spreadsheets (Excel / Google Sheets)
Pros:
- Flexible customization to your needs
- Automatic formulas for statistics
- Accessibility (Google Sheets — free)
Cons:
- Takes time to set up
- No automatic trade import
- Need to manually update data
Who it’s for: traders who want full control over data structure.
Specialized Platforms (TMM and similar)
Pros:
- Automatic trade import via API
- Ready-made analytics and charts
- Synchronization with multiple exchanges
- History preservation when changing brokers
Cons:
- May have subscription fee (usually $20-50/month)
- Less flexibility in field customization
- Requires trust in the platform (API access)
Who it’s for: active traders, users of multiple exchanges, those who value time.
What to Record in a Journal
Required Fields
| Field | Description | Example |
|---|---|---|
| Date and Time | When trade was opened/closed | 2026-03-05 14:30 |
| Asset | Trading pair | BTC/USDT |
| Direction | Long or short | Long |
| Volume | Position size | 0.1 BTC |
| Entry Price | Price at entry | $42,500 |
| Exit Price | Price at exit | $43,200 |
| Result | Profit/loss in $ and % | +$70 (+1.65%) |
| Fees | Trading fees | -$0.84 |
Recommended Fields
| Field | Description | Example |
|---|---|---|
| Setup | Signal type | RSI < 30 + bounce from support |
| Entry Reason | Why you entered | Oversold by RSI |
| Exit Reason | Why you exited | Take-profit reached |
| Stop-Loss | Where was stop | $41,800 |
| Take-Profit | Where was target | $43,500 |
| Emotions | State during trade | Calm, confident |
| Mistakes | What went wrong | Entry too early |
| Takeaways | What to consider next time | Wait for candle confirmation |
Example Entry
Date: 2026-03-05 14:30
Asset: BTC/USDT
Direction: Long
Volume: 0.1 BTC
Entry: $42,500
Exit: $43,200
Result: +$70 (+1.65%)
Setup: Bounce from support + RSI < 30
Entry Reason: Oversold, divergence on M30
Exit Reason: Take-profit reached
Stop-Loss: $41,800 (-1.65%)
Take-Profit: $43,500 (+2.35%)
Emotions: Calm, followed the plan
Mistakes: None
Takeaways: Setup worked perfectly, keep it up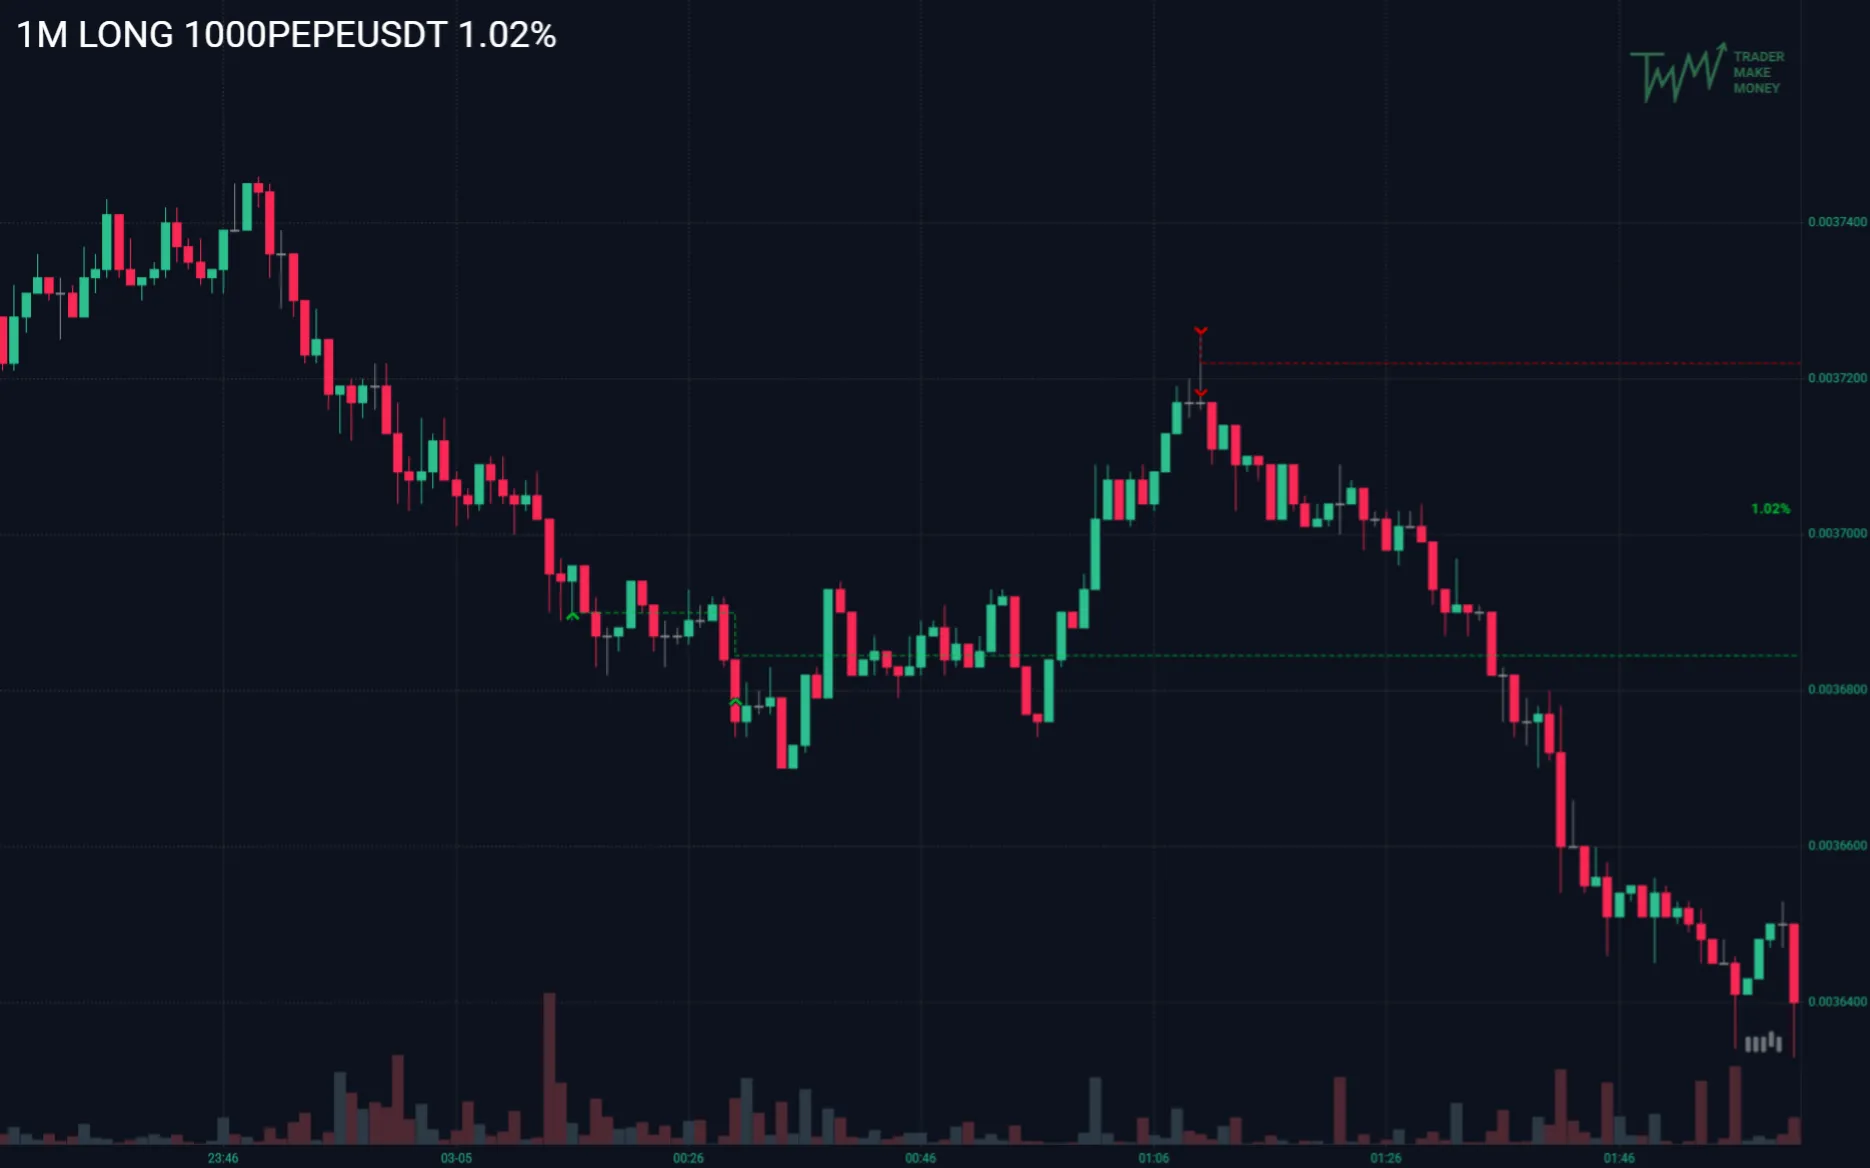 Fig. 2. Detailed trade information in TMM: entry/exit prices, PnL, metrics
How to Analyze Entries
Weekly Review
Once a week, it’s useful to review:
- Total PnL — profit/loss for the week
- Win rate — percentage of successful trades
- Largest profit/loss — which trades gave maximum results
- Repeated mistakes — what hinders stability
Monthly Report
Once a month — deeper analysis:
- Deposit dynamics — capital change chart
- Setup statistics — which signals work better
- Asset statistics — which pairs you trade more successfully
- Time statistics — what time of day results are better
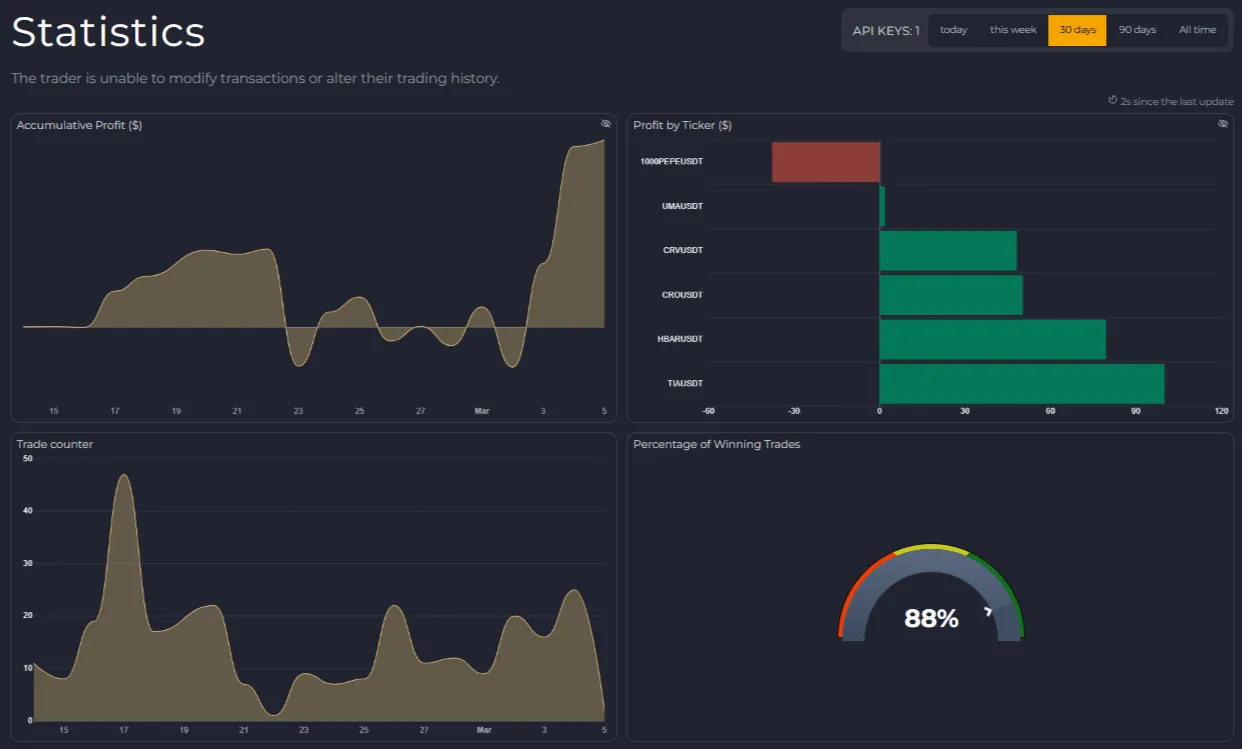 Fig. 3. Monthly statistics: deposit chart, win rate, average profit/loss
Working on Mistakes
After analysis — action plan:
- Identify 1-2 key mistakes
- Determine how to avoid them (rules, filters, limitations)
- Implement changes in trading system
- Check results in a week
Integration with Risk Management
A trading journal is an integral part of the risk management system:
- Trade risk control — recording helps not to exceed the limit
- Drawdown tracking — you see when to reduce volumes
- Stop-loss discipline — recording all losses, no “heroism”
- Risk/reward analysis — statistics for optimization
More on capital protection in the article on risk management in crypto trading.
Common Mistakes When Keeping a Journal
- Irregularity — entries “when I remember.” A journal only works with systematic maintenance.
- Incomplete data — missing entry/exit reasons, emotions, takeaways.
- Analysis without action — collected statistics but changed nothing.
- Focus on profit — looking only at profit, ignoring mistakes.
- Lack of honesty — writing “no mistakes” when there were.
Summary
A trading journal is a tool for discipline and analysis. It doesn’t guarantee profit, but provides data for decision-making. Format (paper, Excel, platform) is a matter of preference. The main thing is regularity and honesty.
Key takeaways:
- Record all trades: entry, exit, reasons, emotions
- Analyze statistics weekly and monthly
- Use data to optimize your strategy
- Don’t hide mistakes — they’re growth points
FAQ
Is it necessary to keep a journal for beginners?
Yes, especially for beginners. It helps form discipline and not repeat mistakes. At the start, it’s more important to learn to record and analyze than to earn.
How much time does keeping a journal take?
5-10 minutes per trade with manual entry. With automatic platforms (TMM) — almost zero, only analysis.
What’s better: paper, Excel, or a platform?
Depends on trading style. Beginners — paper or Excel to understand structure. Active traders — platforms with auto-import.
Should you record emotions?
Yes. Emotions affect decisions. If you see a pattern “after a loss I want to win back — break rules,” it will help change behavior.
How long to keep records?
Minimum a year — for seasonality and long-term results assessment. Better — indefinitely, it’s your growth history.
Can you use multiple formats?
Yes. For example, TMM for automatic import + paper journal for notes and reflection.
Is a public journal safe?
Yes, if you use view-only API keys. Never give keys with withdrawal rights.
Disclaimer
This blog is for informational purposes only. It does not constitute financial or investment advice.
Trading cryptocurrencies and other financial instruments involves high risk. You may lose all your funds.
The author is not responsible for any financial losses resulting from the use of information from this blog.