Fundamental analysis helps understand whether an asset deserves attention and if the market is overheated. In crypto there are no IFRS reports, but there are on-chain metrics, tokenomics, and macro. This article covers how FA in crypto differs from classics and how to combine it with technical analysis.
Introduction: Why Traders Need Fundamentals
Most traders start with candles, levels, and indicators. Fundamentals seem “long and complicated,” so they’re often postponed. Without them, the “enter or not” decision relies mainly on the chart: trend exists — enter, no trend — wait. But the same chart can be both the start of a strong move and a trap before a crash. Fundamental analysis doesn’t give an exact entry point, but helps filter out junk and understand context: are we closer to overheating or to a zone where the asset historically bounced?
It makes sense to use FA as a filter: first “is this asset worth looking at,” then technical analysis for entry point. More on fitting the check into 15 minutes — in the fundamental analysis checklist.
Why fundamentals matter:
- Junk filter: screens out weak projects before entry
- Cycle context: understanding where the market is (bottom, growth, peak, fall)
- Risk assessment: tokenomics, regulation, team
- Long-term perspective: technical analysis gives entry point, fundamentals give reason to hold
What is Fundamental Analysis in Classics
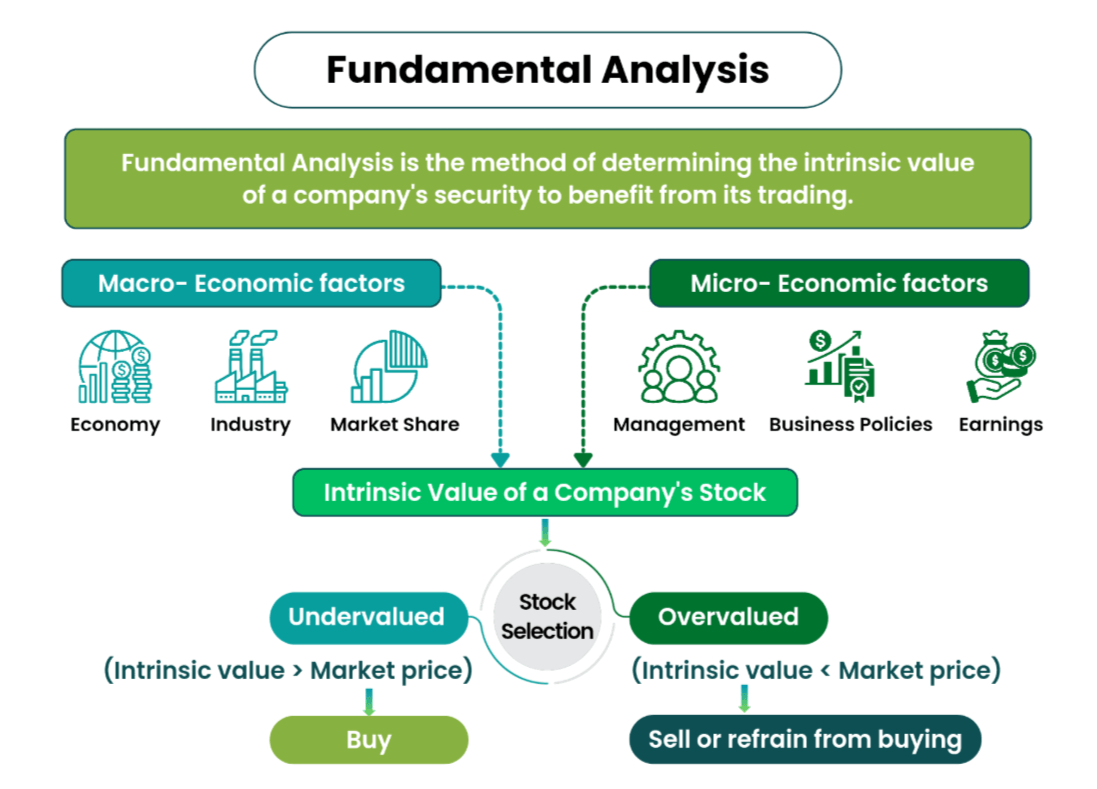
In traditional finance, fundamental analysis is evaluating an asset by its “intrinsic” value, not just by the price on a chart.
For stocks they look at the business: revenue, profit, debt, multiples (e.g., P/E — price-to-earnings ratio), dividends, market share. Question: “How much does the company earn and how much does the stock price reflect that?”
For currencies — on the country or zone’s economy: central bank rates, inflation, trade balance, unemployment. Question: “Is the currency strong from an economic standpoint?”
For bonds — on the issuer’s creditworthiness: rating, debt, cash flows. Question: “Will the issuer return money with interest?”
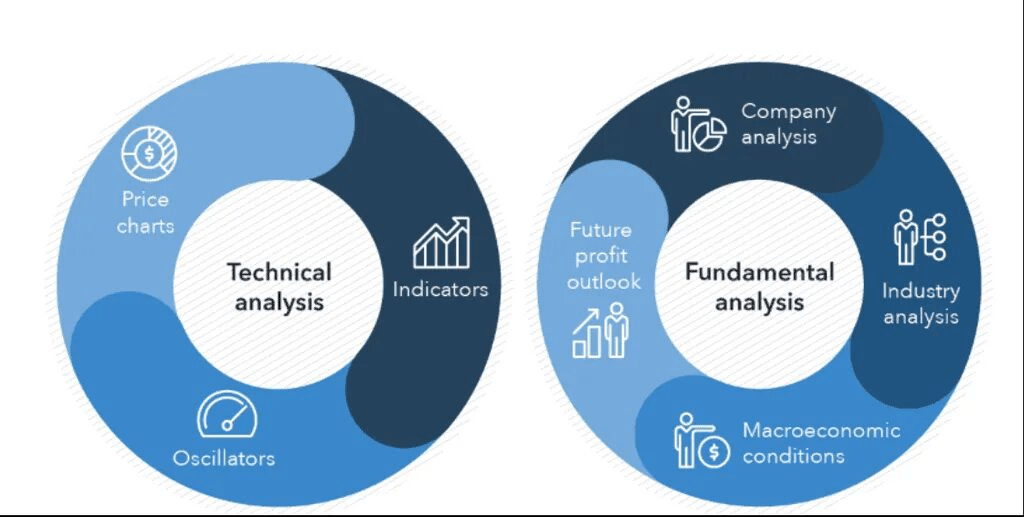
In both cases, FA answers “what to buy or hold” and “are we overpaying,” not “at what point to place an order.” Technical analysis gives the entry point.
Data sources in classics:
- Financial statements (10-K, 10-Q for USA)
- Central bank and government data (rates, inflation, GDP)
- Rating agencies (Moody’s, S&P, Fitch)
- News aggregators (Bloomberg, Reuters)
How Crypto Fundamentals Differ
In crypto there are no IFRS reports and no central bank. There’s no single project “balance sheet” in the classical sense. So the dataset is different.
What exists instead:
- Network technology and architecture — how the blockchain is structured, speed, fees, security.
- On-chain metrics — data from the chain itself: MVRV, NVT, exchange reserves, coin movements. They show how participants behave “inside” the network. More details — in the on-chain metrics article.
- Tokenomics — emission, supply cap, vesting, unlock schedules. Question: “Will a mass release of tokens crash the price?”
- Team, community, regulation — who’s behind the project, is there a live product and community, how is the regulatory landscape changing.
Conditionally: in stocks fundamentals are “business and money,” in crypto — “network, incentives, and blockchain data.” The goal is the same — understand if the asset is overheated and if it has a foundation for long-term interest.
Data sources in crypto:
- Blockchain explorers (Etherscan, Blockchain.com)
- On-chain services (Glassnode, CryptoQuant, Nansen)
- Tokenomics aggregators (Token Unlocks, Token Terminal)
- Social media and community (Twitter, Discord, Telegram)
Fundamental and Technical Analysis: How They Work Together
FA and TA solve different tasks. It makes sense to use them sequentially.
Fundamentals answer: “Is this asset worth attention?”, “Are we closer to overheating or to undervaluation/capitulation?”, “Are there structural risks (tokenomics, regulation)?”
Technical analysis answers: “Where exactly to enter and exit in the coming days or weeks?”, “Which levels and indicators confirm the scenario?”
Practical example: on-chain and tokenomics show the asset is not in an overheating zone and large wallets are accumulating. Then on the chart we look for long setups — levels, indicators, volume. Conversely: if FA indicates overheating or mass unlocks, it’s wiser not to add to longs and look for points to take profit or short.
Decision matrix:
| FA | TA | Decision |
|---|---|---|
| ✅ Strong | ✅ Signal | Enter with full position |
| ✅ Strong | ❌ No signal | Wait, asset in portfolio |
| ❌ Weak | ✅ Signal | Skip or short trade |
| ❌ Weak | ❌ No signal | Ignore asset |
Framework: Three Steps for Traders
It’s convenient to break down fundamental verification into three blocks. You don’t have to dive deep into all at once — can start with one and expand.
Step 1. Macro and Narrative
Central bank rates, crypto regulation, main market “stories” (halving, ETF, sanctions, etc.). This is the context in which the entire market and individual coins move.
What to watch:
- Fed rate (interest rates in USA)
- Inflation (CPI, PCE)
- Regulatory news (SEC, crypto laws)
- Narratives (halving, ETF, DeFi, NFT, AI)
Where to look:
- Economic Calendar (ForexFactory, Investing.com)
- Regulators’ Twitter (@SEC_News, @CFTC)
- Crypto media (CoinDesk, Cointelegraph, The Block)
Example: In 2024 the narrative was Bitcoin ETF. SEC approval led to institutional money inflow and BTC growth from $40,000 to $73,000. Those who tracked macro-context were able to enter in advance.
Step 2. Asset Quality
Top coins with liquidity and history vs unknown tokens; technology, tokenomics, team, and product. The goal is to filter out what’s not worth even looking at the chart.
Checklist:
- Top 100 by market cap (CoinMarketCap, CoinGecko)
- Working product (website, documentation, GitHub)
- Active community (Twitter, Discord, Telegram)
- Transparent tokenomics (whitepaper, unlock schedule)
Red flags:
- ❌ Anonymous team without experience
- ❌ No working product (only whitepaper)
- ❌ Tokenomics with 50%+ to team without vesting
- ❌ Community only with bots and spam
Example: Let’s compare two projects:
- Project A: Top 50, public team, working product, tokenomics with 15% to team (vesting 4 years)
- Project B: Top 500, anonymous, no product, 40% tokens to team without vesting
Conclusion: Project A passes the filter, Project B — red flag.
Step 3. On-Chain Cycle Context
MVRV, exchange reserves, network activity. Helps understand which cycle phase we’re in: accumulation, growth, distribution, or capitulation.
Key metrics:
- MVRV < 1 — undervaluation zone
- Outflow from exchanges — accumulation
- SOPR < 1 — capitulation
- Whale activity — growing interest
Cycle phases:
| Phase | MVRV | Exchange Reserves | Behavior | Strategy |
|---|---|---|---|---|
| Accumulation | < 1 | Outflow | Whales buying | DCA, accumulation |
| Growth | 1-2 | Stable | Retail entering | Long, trading |
| Distribution | 2-3 | Inflow | Whales selling | Take profit |
| Capitulation | > 3 | Sharp inflow | Panic, liquidations | Wait for bottom |
Example: In November 2022 (FTX crash):
- MVRV BTC: 0.95 (< 1, undervaluation zone)
- Exchange reserves: +200,000 BTC per week (panic)
- SOPR: < 1 (mass losses)
Conclusion: Capitulation phase. 3 months later BTC grew from $15,500 to $30,000 (+93%).
Detailed breakdown of on-chain metrics — in the separate article; quick token scan — in the 15-minute checklist.
Historical Examples: When FA Saved from Losses
Example 1: LUNA (2022) — Ignoring Fundamentals
What happened:
- Tokenomics: algorithmic stablecoin UST, peg via burning LUNA
- Inflation: unlimited (printing UST without backing)
- Reserves: $3B with UST market cap $18B
Red flags (ignored):
- ❌ No real backing (only algorithm)
- ❌ Unlimited emission
- ❌ High dependence on one protocol (Anchor Protocol, 20% APY)
Result:
- May 2022: UST loses peg, LUNA falls from $80 to $0.0001 (-99.99%)
- Investors lost $40+B
Lesson: Tokenomics with unlimited emission = high risk.
Example 2: BTC (2022) — FA Showed the Bottom
What happened:
- MVRV: < 1 (capitulation zone)
- Exchange reserves: outflow 500,000+ BTC over 3 months
- SOPR: < 1 (mass losses)
- 2024 Halving: predictable event
Green flags:
- ✅ MVRV < 1 (historically buy zone)
- ✅ Outflow from exchanges (accumulation)
- ✅ Predictable halving in 1.5 years
Result:
- Bottom: $15,500 (November 2022)
- December 2024: peak $108,000 (+597%)
Lesson: On-chain metrics showed the bottom before the chart.
Example 3: FTT (2022) — Risk Concentration
What happened:
- FTX exchange token
- Tokenomics: 38% tokens to team, 33% to Alameda Research
- Using FTT as collateral for loans
Red flags:
- ❌ 70%+ concentration in two structures
- ❌ FTT as collateral (circular dependence)
- ❌ No reserve transparency
Result:
- November 2022: FTX collapse, FTT falls from $22 to $1 (-95%)
- Investors lost $8+B
Lesson: Token concentration + lack of transparency = high risk.
Time Allocation: How Much to Spend on Fundamentals
For day trading (1-5 days):
- 10-15 minutes on checklist
- Focus: tokenomics, unlocks, narratives
- TA: 80% time, FA: 20%
For swing trading (1-4 weeks):
- 30-60 minutes on analysis
- Focus: on-chain, asset quality
- TA: 60% time, FA: 40%
For long-term investments (3+ months):
- 2-4 hours on deep analysis
- Focus: macro, technology, team, tokenomics
- TA: 30% time, FA: 70%
Data updates:
- Top-10 assets: once per week
- Top-100 assets: once per 2 weeks
- Top-500+ assets: before every entry
Limitations of Fundamental Analysis
FA is a powerful tool, but not perfect.
Limitations:
- Doesn’t give exact entry and exit points
- Requires time to study (30-60 minutes per asset)
- Data may be incomplete or outdated
- In crypto, high volatility overrides fundamentals on short distances
How to reduce risks:
- Combine FA with TA and risk management
- Use checklists to speed up analysis
- Track updates (tokenomics, regulation)
- Don’t rely on a single data source
Summary
Fundamental analysis is an indispensable tool for asset selection and market context consideration. Combine it with technical analysis for a complete picture.
Key takeaways:
- FA answers “what to buy,” TA answers “when to enter”
- In crypto, on-chain metrics, tokenomics, team are used
- Framework: macro → asset quality → on-chain context
- Combine FA with TA and risk management
More on tokenomics read in the What is Tokenomics article.
FAQ
What is fundamental analysis in simple terms?
Asset evaluation by “intrinsic” data: for stocks — business and profits, for currencies — economy, for crypto — technology, tokenomics, and blockchain data. Question: “Is this asset worth its money and is the market overheated?”
How does FA in crypto differ from FA in stocks?
In crypto there are no IFRS reports. Instead, on-chain metrics (MVRV, exchange reserves, coin movements), tokenomics (emission, unlocks), technology and team assessment are used. The goal is the same — understand value and risks.
How to combine fundamental and technical analysis?
First FA: “is it worth looking at this asset, is it overheated.” Then TA: “where to enter and exit” by levels and indicators. FA sets context and filter, TA — entry and exit points.
Why does a trader need on-chain metrics?
They show participant behavior in the network (accumulation, selling, exchange reserves) and cycle phase. This complements the chart: chart says “how” price moves, on-chain — “why” and “how sustainable it is.”
How long does fundamental analysis take?
Initial assessment: 15-30 minutes (checklist). Deep analysis: 1-2 hours (tokenomics, team, competitors, on-chain). For permanent assets, updating data once per week or before major events is enough.
Which services to use for fundamental analysis?
- On-chain: Glassnode, CryptoQuant, Nansen
- Tokenomics: Token Unlocks, Token Terminal
- Aggregators: CoinMarketCap, CoinGecko
- News: Twitter, Discord, Telegram of projects
Can I trade only by fundamentals?
No. FA doesn’t give exact entry points. Even with strong fundamentals, an asset can fall for weeks or months. Use TA for entry and stop-losses to protect capital.
Disclaimer
This blog is for informational purposes only. It does not constitute financial or investment advice.
Trading cryptocurrencies and other financial instruments involves high risk. You may lose all your funds.
The author is not responsible for any financial losses resulting from the use of information from this blog.