On-chain analysis is working with data from the blockchain itself: transactions, wallets, asset flows. If technical analysis shows how price moves, on-chain explains why it happens. For a trader, on-chain metrics are part of fundamental analysis: they help assess cycle context, overheated or undervalued zones, and large players’ behavior. This article covers key metrics to track and how not to overstate their role.
Why traders use on-chain data
The blockchain is a public ledger: all transfers, balances, and coin flows are recorded there. On-chain analysis reveals large players’ footprints, accumulation zones, and signals that appear late or not at all on the chart. It does not replace technical analysis but complements it: it helps choose when to enter or exit, position size, and level of aggression. On-chain sets cycle context and participant sentiment; entry and exit points are still found from levels, indicators, and volume on the chart.
Five on-chain metrics for fundamental context
1. Coin flows to and from exchanges
Large on-chain transfers often set market direction.
- Coins flowing to exchanges — supply “for sale” rises; correction or selling pressure is possible.
- Coins leaving exchanges for wallets — accumulation; participants are less willing to sell, liquidity is “locked.”
Services like Glassnode or CryptoQuant show exchange balances and flows. Not every large transfer is a signal: there are internal transfers, market makers, arbitrage. Look at trend and volume, not a single transaction.
Example: If 50,000+ BTC left exchanges in a week, that’s an accumulation signal. If 30,000+ BTC came in — possible selling pressure.
2. MVRV (Market Value to Realized Value)
MVRV compares market cap with the “realized” value of coins (at the price of last move). In essence — how much the market values the asset above or below average acquisition price.
- MVRV < 1 — market price below “realized”; many hold at a loss. Often read as undervaluation or capitulation.
- MVRV > 3–3.5 — strong overheating; many in profit, incentive to take profit rises. Correction risk is higher.
MVRV does not give a precise buy/sell point but sets context: in MVRV < 1 it’s wiser to look for long setups and not overload shorts; at MVRV > 3 — be cautious adding to longs and watch for distribution on the chart.
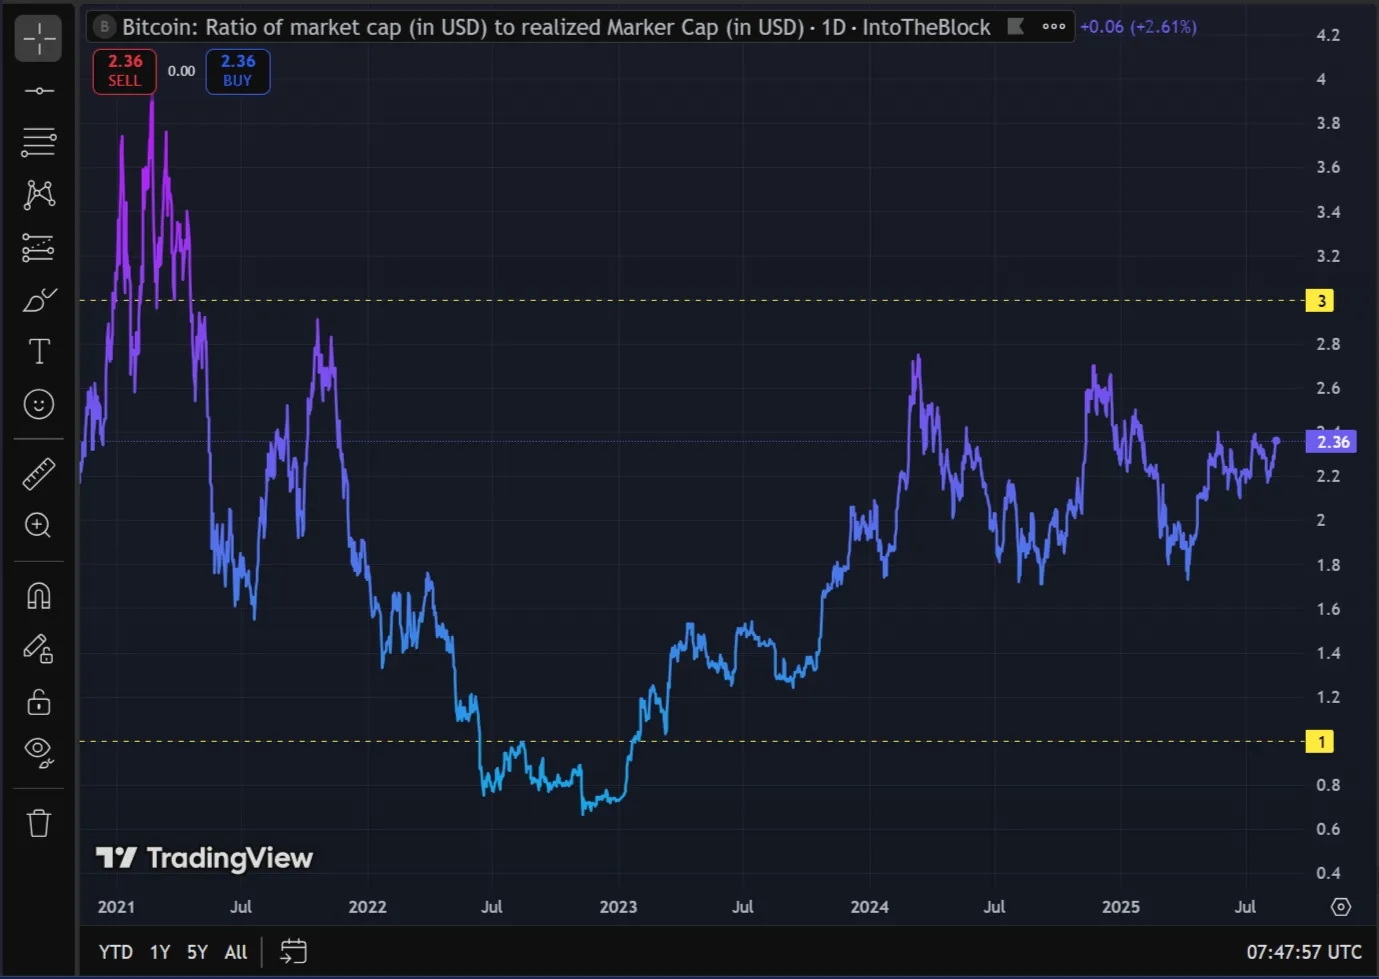
Historical data:
- 2018 bottom: MVRV ≈ 0.8
- 2021 peak: MVRV ≈ 3.8
- 2022 bottom (FTX): MVRV ≈ 0.9
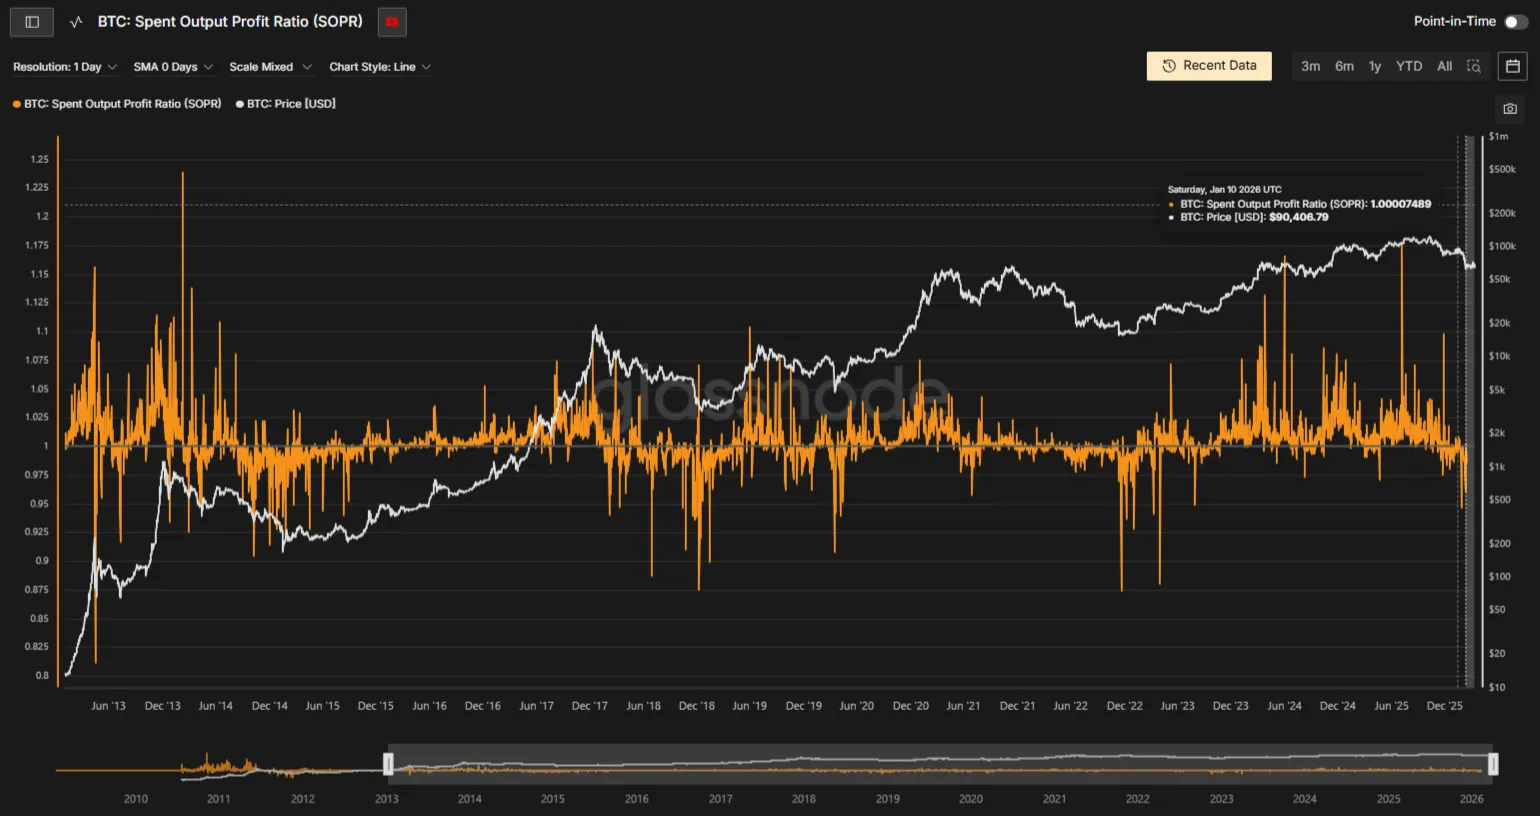
3. SOPR (Spent Output Profit Ratio)
SOPR shows whether participants are selling at a profit or loss (from the average price of “spent” outputs).
- SOPR > 1 — profit-taking; many sellers in profit, market can cool off.
- SOPR < 1 — loss-taking; often linked to capitulation and a possible bounce.
Like MVRV, SOPR is better used as a sentiment filter, not the only trigger. Combining with technical analysis (levels, volume, RSI) gives more robust decisions.
Variations:
- aSOPR (adjusted SOPR) — excludes transactions shorter than 1 hour (noise)
- SOPR by group — separately for whales (>1000 BTC), sharks (100-1000 BTC), retail
4. Risk zones on futures (liquidations)
On futures markets, positions pile up with liquidations “hanging” below or above. Analyzing these zones helps assess the risk of sharp moves.
- Many longs near liquidation — a drop can trigger cascading liquidations and accelerate the fall.
- Shorts near liquidation — a rally can cause a short squeeze and a sharp bounce up.
Liquidation data is available on Coinglass, for example. Use it when sizing positions and setting stop losses, not as a replacement for your trading system.
Example: If $500M of short liquidations are stacked at $95,000, a break above $95,000 could trigger a sharp spike to $98,000-100,000 due to chain reaction of position closures.
5. Large holder activity
Tracking large-holder wallets and flows into new projects shows where capital is moving. Large investors accumulating an asset — possible interest signal; mass outflow into a new token — shift of focus. Such data is available from Nansen, Arkham and similar services. Interpret with care: “whales” can create false trails or act in market-making interests.
Holder classification:
- Whales: >1,000 BTC (or equivalent)
- Sharks: 100-1,000 BTC
- Fish: 10-100 BTC
- Retail: <10 BTC
Services for on-chain analysis

Glassnode:
- Metrics: MVRV, SOPR, exchange balances, active addresses
- Pricing: free (basic), $29/mo (advanced)
CryptoQuant:
- Metrics: exchange reserves, flows, whales, futures
- Pricing: free (basic), $29/mo (pro)
Nansen:
- Metrics: whale wallets, smart money, new projects
- Pricing: from $199/mo
Dune Analytics:
- Metrics: custom dashboards, DeFi, NFT
- Pricing: free (basic), $199/mo (pro)
Coinglass:
- Metrics: liquidations, open interest, long/short ratio
- Pricing: free
.Z-bqUB6W_Z1bxehQ.webp)
For on-chain trading automation, platforms like Veles offer built-in metrics and bots for signal-based execution.
Pitfalls of on-chain data
On-chain analysis is powerful but not perfect. A large transfer can be an internal move or OTC deal, not a market signal. Data can lag; aggregate metrics (MVRV, SOPR) smooth the picture. To reduce risk, combine on-chain metrics with technical analysis and volume — so the strategy depends less on one group of signals and is more robust to market traps.
How to add on-chain to your process
- Gather data — Glassnode, CryptoQuant, Nansen, Dune Analytics: transactions, exchange reserves, MVRV, SOPR.
- Look for context — undervaluation (MVRV < 1), accumulation (outflow from exchanges), liquidation risk on futures.
- Tie to technical analysis — e.g. MVRV < 1 and coins leaving exchanges → look for long setups by levels and indicators; SOPR > 1 and mass inflow to exchanges → be cautious with new longs, check for distribution.
- Check on history — if you use backtests, you can use on-chain conditions as a period filter (e.g. only go long when MVRV is below a threshold).
On-chain data is not a replacement for the chart and indicators but a way to make decisions more informed: who is moving the market, where liquidity is concentrated, and which phase of the cycle you’re in. Together with fundamental and technical analysis, on-chain helps not just follow trends but better assess risks and opportunities.
Platforms like Veles offer automated on-chain trading with built-in metrics and bots for signal-based execution.
Summary
Briefly: the key points are above; use them as a practical checklist and combine with risk management.
FAQ
What is MVRV in simple terms?
MVRV (Market Value to Realized Value) compares current market cap with the “realized” value of coins (at last-move price). MVRV < 1 — many hold at a loss, often read as undervaluation; MVRV > 3 — strong overheating, higher correction risk.
Where to see exchange reserves and flows?
Services like Glassnode, CryptoQuant and similar show exchange balances and coin flows to and from exchanges. Futures liquidation data — e.g. Coinglass.
Does on-chain replace technical analysis? No. On-chain complements technical analysis: it gives cycle context and participant sentiment. Entry and exit points are still found from levels, indicators, and volume on the chart.
Disclaimer
This blog is for informational purposes only. It does not constitute financial or investment advice.
Trading cryptocurrencies and other financial instruments involves high risk. You may lose all your funds.
The author is not responsible for any financial losses resulting from the use of information from this blog.