On-chain analysis is working with data from the blockchain itself: transactions, wallets, asset movements. If technical analysis shows how price moves, on-chain explains why it happens. For traders, on-chain metrics are part of fundamental analysis: they help assess cycle context, overheating or undervaluation zones, and behavior of large players. This article covers key metrics to track and how not to overestimate their role.
Why Traders Need On-Chain Data
Blockchain is a public ledger: all transfers, balances, and coin movements are recorded there. On-chain analysis reveals traces of large players, accumulation zones, and signals that appear on the chart with delay or not at all. It doesn’t replace technical analysis, but complements it: helps choose entry or exit timing, position size, and aggression level. On-chain sets cycle context and participant sentiment; specific entry and exit points are still found by levels, indicators, and volume on the chart.
Advantages of on-chain analysis:
- Transparency: all data from public blockchain
- Less delay than chart: large transfers visible immediately
- Context: understanding who moves the market (whales, retail, exchanges)
- False signal filter: TA + on-chain = fewer false entries
Limitations:
- Not all transactions are signals (there are internal transfers, OTC)
- Data may lag by several blocks
- Aggregated metrics smooth the picture
- Requires interpretation in context
Five On-Chain Metrics for Fundamental Context
1. Exchange Flows (Inflows/Outflows)
Large transfers on blockchain often set market direction.
- Coins flowing to exchanges — “for sale” supply increases; correction or price pressure possible.
- Coins leaving exchanges to wallets — accumulation; participants less ready to sell, liquidity “locked up.”
Services like Glassnode or CryptoQuant show exchange balances and flows. Not every large transaction is a signal: there are internal transfers, market-makers, arbitrage. Look at trend and volume, not single transaction.
Example: If 50,000+ BTC left exchanges in a week, this is accumulation signal. If 30,000+ BTC arrived — potential price pressure.
2. MVRV (Market Value to Realized Value)
MVRV compares market capitalization with “realized” value of coins (by price of last movement). Essentially — how much the market values asset above or below average acquisition price.
- MVRV < 1 — market price below “realized”; many holding at loss. Often interpreted as undervaluation or capitulation zone.
- MVRV > 3-3.5 — strong overheating; many in profit, temptation to take profit grows. Correction risk higher.
MVRV doesn’t give exact “buy/sell” point, but sets context: in MVRV < 1 zone it’s wiser to look for long setups and not overload short; at MVRV > 3 — be more careful adding to long and watch for distribution signs on chart.
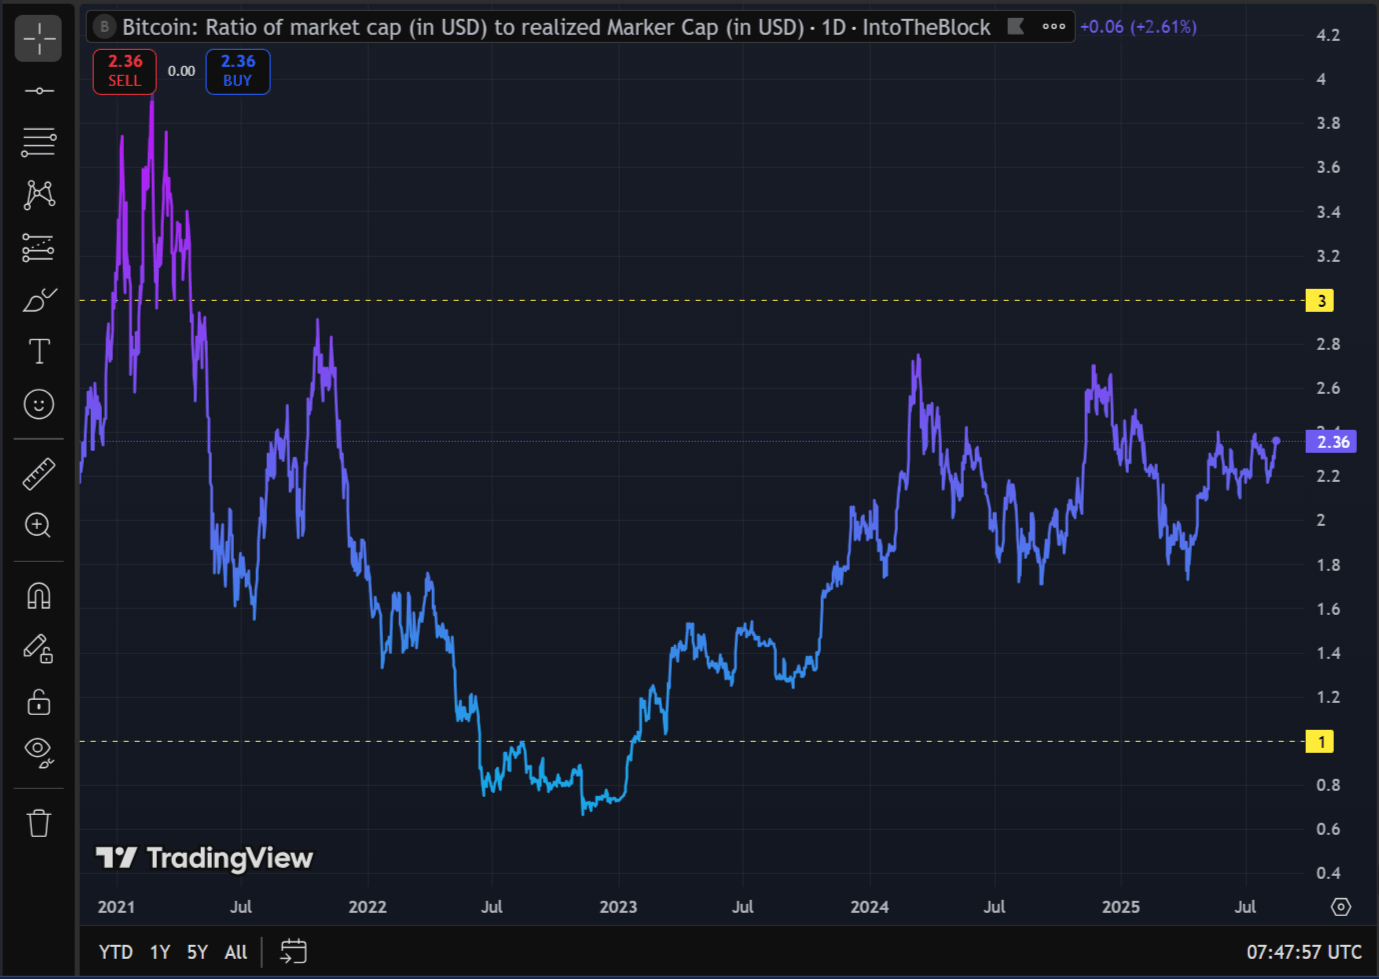
Historical data:
- 2018 bottom: MVRV ≈ 0.8
- 2021 peak: MVRV ≈ 3.8
- 2022 bottom (FTX): MVRV ≈ 0.9
3. SOPR (Spent Output Profit Ratio)
SOPR shows whether participants are selling at profit or loss (by average price of “spent” outputs).
- SOPR > 1 — profit taking; many sellers in profit, market may cool down.
- SOPR < 1 — loss sales; often associated with capitulation and possible bounce.
Like MVRV, SOPR is better used as sentiment filter, not sole trigger. Combination with technical analysis (levels, volume, RSI) gives more stable decisions.
Variations:
- aSOPR (adjusted SOPR) — excludes transactions shorter than 1 hour (noise)
- SOPR by groups — separately for whales (>1000 BTC), sharks (100-1000 BTC), retail
4. Futures Risk Zones (Liquidations)
On futures markets, positions accumulate under which liquidations “hang.” Analyzing these zones helps assess sharp move risk.
- Many long positions under liquidation threat — on price drop, cascade liquidation and acceleration of fall possible.
- Shorts on verge of liquidation — on rise, short-squeeze and sharp bounce up possible.
Liquidation data available, for example, on Coinglass. Useful to consider when choosing position size and stop-losses, not as replacement for own trading system.
Example: If $500M of short liquidations accumulated at $95,000 level, on breakout above $95,000 sharp jump to $98,000-100,000 possible due to chain reaction of position closures.
5. Large Holder Activity
Tracking wallets of large holders and flows into new projects shows where capital is moving. Large investors accumulating asset — possible interest signal; mass withdrawal into new token — focus shift. Such data available in Nansen, Arkham and similar services. Interpret with caution: “whales” can create false traces or act in market-making interests.
Holder classification:
- Whales: >1,000 BTC (or equivalent)
- Sharks: 100-1,000 BTC
- Fish: 10-100 BTC
- Retail: <10 BTC
On-Chain Analysis Services

Glassnode:
- Metrics: MVRV, SOPR, exchange balances, active addresses
- Pricing: free (basic), $29/month (advanced)
- For: long-term investors, analysts
CryptoQuant:
- Metrics: exchange reserves, flows, whales, futures
- Pricing: free (basic), $29/month (pro)
- For: traders, day trading
Nansen:
- Metrics: whale wallets, smart money, new tokens
- Pricing: $199/month (premium)
- For: advanced users, alpha hunters
Arkham Intelligence:
- Metrics: wallet tracking, connections between addresses
- Pricing: free (basic), $99/month (pro)
- For: researchers, journalists
Token Terminal:
- Metrics: protocol revenue, P/E, active users
- Pricing: free (basic), $29/month (pro)
- For: DeFi fundamental analysts
NuNet: Aggregated Metrics for Quick Analysis
NuNet is an on-chain metric aggregator that simplifies analysis for traders. Instead of looking at 10+ metrics separately, NuNet combines them into single indicators.
Key NuNet indicators:
1. URC (Universal Risk Characteristic):
- Range: 0-100
- < 20: accumulation zone (buy)
- 20-50: neutral zone
-
80: overheating zone (sell)
2. BTC Power:
- Shows Bitcoin dominance
- Rising → altcoins weakening
- Falling → altcoins growing (altseason)
3. ETH/BTC Ratio:
- ETH to BTC price ratio
- Rising → altseason
- Falling → BTC dominance
NuNet advantages:
- ✅ Time saving (1 metric instead of 10)
- ✅ Less analysis paralysis
- ✅ Fast entry/exit signals
NuNet disadvantages:
- ❌ Less depth of analysis
- ❌ Paid subscription ($49/month)
- ❌ Works only for BTC and ETH
How to use:
- NuNet for quick context (5 minutes)
- Glassnode/CryptoQuant for deep analysis (30-60 minutes)
Metrics for Altcoins: What to Watch
Altcoins have their specifics. Here are key metrics:
1. TVL (Total Value Locked)
What it is: Total value of tokens locked in DeFi protocol.
Where to check: DefiLlama, Token Terminal
Interpretation:
- TVL rising → interest in protocol growing
- TVL falling → users leaving
Example:
- Uniswap TVL: $3B → $4B (+33%)
- Conclusion: interest in protocol growing, can consider long UNI token
2. Revenue (Protocol Revenue)
What it is: Fees generated by protocol.
Where to check: Token Terminal, DefiLlama
Interpretation:
- Revenue rising → protocol earning
- Revenue falling → interest declining
P/E Ratio (Price-to-Earnings):
- Market cap / Annual revenue
- P/E < 10: undervalued
- P/E > 50: overvalued
Example:
- AAVE: Market Cap $1.5B, Revenue $50M/year
- P/E = 30 (medium valuation)
3. Active Addresses
What it is: Number of unique addresses using protocol.
Where to check: Glassnode, Dune Analytics
Interpretation:
- Addresses rising → adoption growing
- Addresses falling → interest declining
Example:
- Arbitrum: 100,000 → 200,000 addresses/day (+100%)
- Conclusion: mass adoption, can consider long ARB
4. Token Unlocks
What it is: Calendar of token unlocks for team, investors, community.
Where to check: TokenUnlocks.app, Vesting trackers
Interpretation:
- Large unlock in 7 days → risk of price pressure
- No unlocks for 3+ months → safe
Example:
- Aptos: 11.1M tokens unlocked October 15
- Price: -20% in week after unlock
Practical Examples: How to Use On-Chain in Trading
Example 1: Buying at Bottom (November 2022)
Situation: FTX collapse, market panic.
On-chain signals:
- MVRV: 0.95 (< 1, capitulation zone) ✅
- SOPR: 0.85 (< 1, mass losses) ✅
- Exchange reserves: +200,000 BTC per week (panic) ❌
- Whale activity: outflow from exchanges 50,000 BTC ✅
Decision:
- 3 of 4 signals indicate bottom
- Entry: $16,000-17,000
- Stop-loss: $15,000
- Take-profit: $25,000 (50%+)
Result:
- Bottom: $15,500 (November 2022)
- 3 months later: $30,000 (+93%)
Example 2: Selling at Peak (November 2021)
Situation: BTC updates all-time high.
On-chain signals:
- MVRV: 3.8 (> 3, overheating zone) ❌
- SOPR: 1.5 (> 1, mass profit taking) ❌
- Exchange reserves: +100,000 BTC in 2 weeks (whales selling) ❌
- Whale activity: mass outflow to stablecoins ❌
Decision:
- 4 of 4 signals indicate overheating
- Take profit: $65,000-69,000
- Move to stablecoins (USDT, USDC)
Result:
- Peak: $69,000 (November 2021)
- 12 months later: $15,500 (-77%)
Example 3: Altseason (2024)
Situation: BTC rising, dominance falling.
On-chain signals:
- BTC Power: falling from 55% to 45% ✅
- ETH/BTC Ratio: rising from 0.05 to 0.08 ✅
- Altcoin TVL: +50% per month ✅
- Altcoin active addresses: +100% ✅
Decision:
- Rotation from BTC to altcoins
- Buy: ETH, SOL, AVAX, ARB
- Stop-loss: -15%
- Take-profit: +50-100%
Result:
- ETH: +80% in 2 months
- SOL: +150% in 2 months
- ARB: +200% in 2 months
Limitations of On-Chain Analysis
Important to understand:
-
Not all transactions are signals
- Internal transfers between wallets
- OTC deals (off exchanges)
- Market-making
-
Data may lag
- MVRV, SOPR: 1-2 days delay
- Exchange reserves: real-time, but not all exchanges transparent
-
Aggregated metrics smooth the picture
- MVRV for whole network ≠ MVRV for whales
- Look at metrics by holder groups
-
Manipulations possible
- Whales can create false traces
- Mass transfers to exchanges ≠ always selling
How to reduce risks:
- Combine 3+ metrics (don’t rely on one)
- Use with technical analysis (levels, volume)
- Check context (news, narratives)
- Watch long-term trend (don’t panic from single signal)
Summary
On-chain analysis is powerful tool for understanding market context and large player behavior. Combine it with technical analysis for complete picture.
Key takeaways:
- On-chain shows “why” price moves, TA shows “how”
- Key metrics: MVRV, SOPR, exchange flows, whale activity
- Use NuNet for quick context, Glassnode for deep dive
- Combine 3+ metrics for confirmation
- Don’t rely solely on on-chain for entry/exit
More on tokenomics: What is Tokenomics.
FAQ
What are on-chain metrics?
Data from blockchain itself: transactions, wallet balances, exchange flows, holder activity. They show what participants are doing inside the network.
Where to check on-chain metrics?
- Glassnode: MVRV, SOPR, exchange balances
- CryptoQuant: exchange reserves, flows, whales
- Nansen: whale wallets, smart money
- TokenUnlocks: token unlock calendars
- DefiLlama: TVL for DeFi protocols
How to interpret MVRV?
- MVRV < 1: undervaluation (many in loss) — consider buying
- MVRV 1-2: neutral zone
- MVRV > 3: overheating (many in profit) — consider taking profit
What are exchange flows telling?
- Outflow from exchanges: accumulation (bullish)
- Inflow to exchanges: potential selling (bearish)
- Look at trend, not single transaction
Can I trade only by on-chain?
No. On-chain doesn’t give exact entry points. Use with technical analysis: on-chain for context, TA for timing.
How often to check on-chain metrics?
- Top-10 assets: once per week
- Top-100 assets: once per 2 weeks
- Before major events: always check (unlocks, upgrades, regulations)
What is SOPR?
Spent Output Profit Ratio — shows whether sellers are in profit or loss. SOPR > 1: profit taking, SOPR < 1: loss sales (capitulation).
Are whale movements reliable signals?
Not always. Whales can create false traces or act in market-making interests. Combine with other metrics and context.
What is NuNet?
On-chain metric aggregator that combines multiple metrics into single indicators (URC, BTC Power, ETH/BTC Ratio). Good for quick context, less depth than individual metrics.
How to use on-chain for altcoins?
Watch TVL (DefiLlama), revenue (Token Terminal), active addresses (Glassnode), token unlocks (TokenUnlocks.app). Combine with BTC dominance and ETH/BTC ratio for altseason timing.
Disclaimer
This blog is for informational purposes only. It does not constitute financial or investment advice.
Trading cryptocurrencies and other financial instruments involves high risk. You may lose all your funds.
The author is not responsible for any financial losses resulting from the use of information from this blog.