A sideways market (range) is a period when price moves inside a horizontal band without a clear uptrend or downtrend. A large portion of market time is spent in ranges, so being able to trade them is an important skill.
In this article we cover how to identify a sideways trend, which indicators to use, several practical strategies, and the most common mistakes.
What is a sideways trend
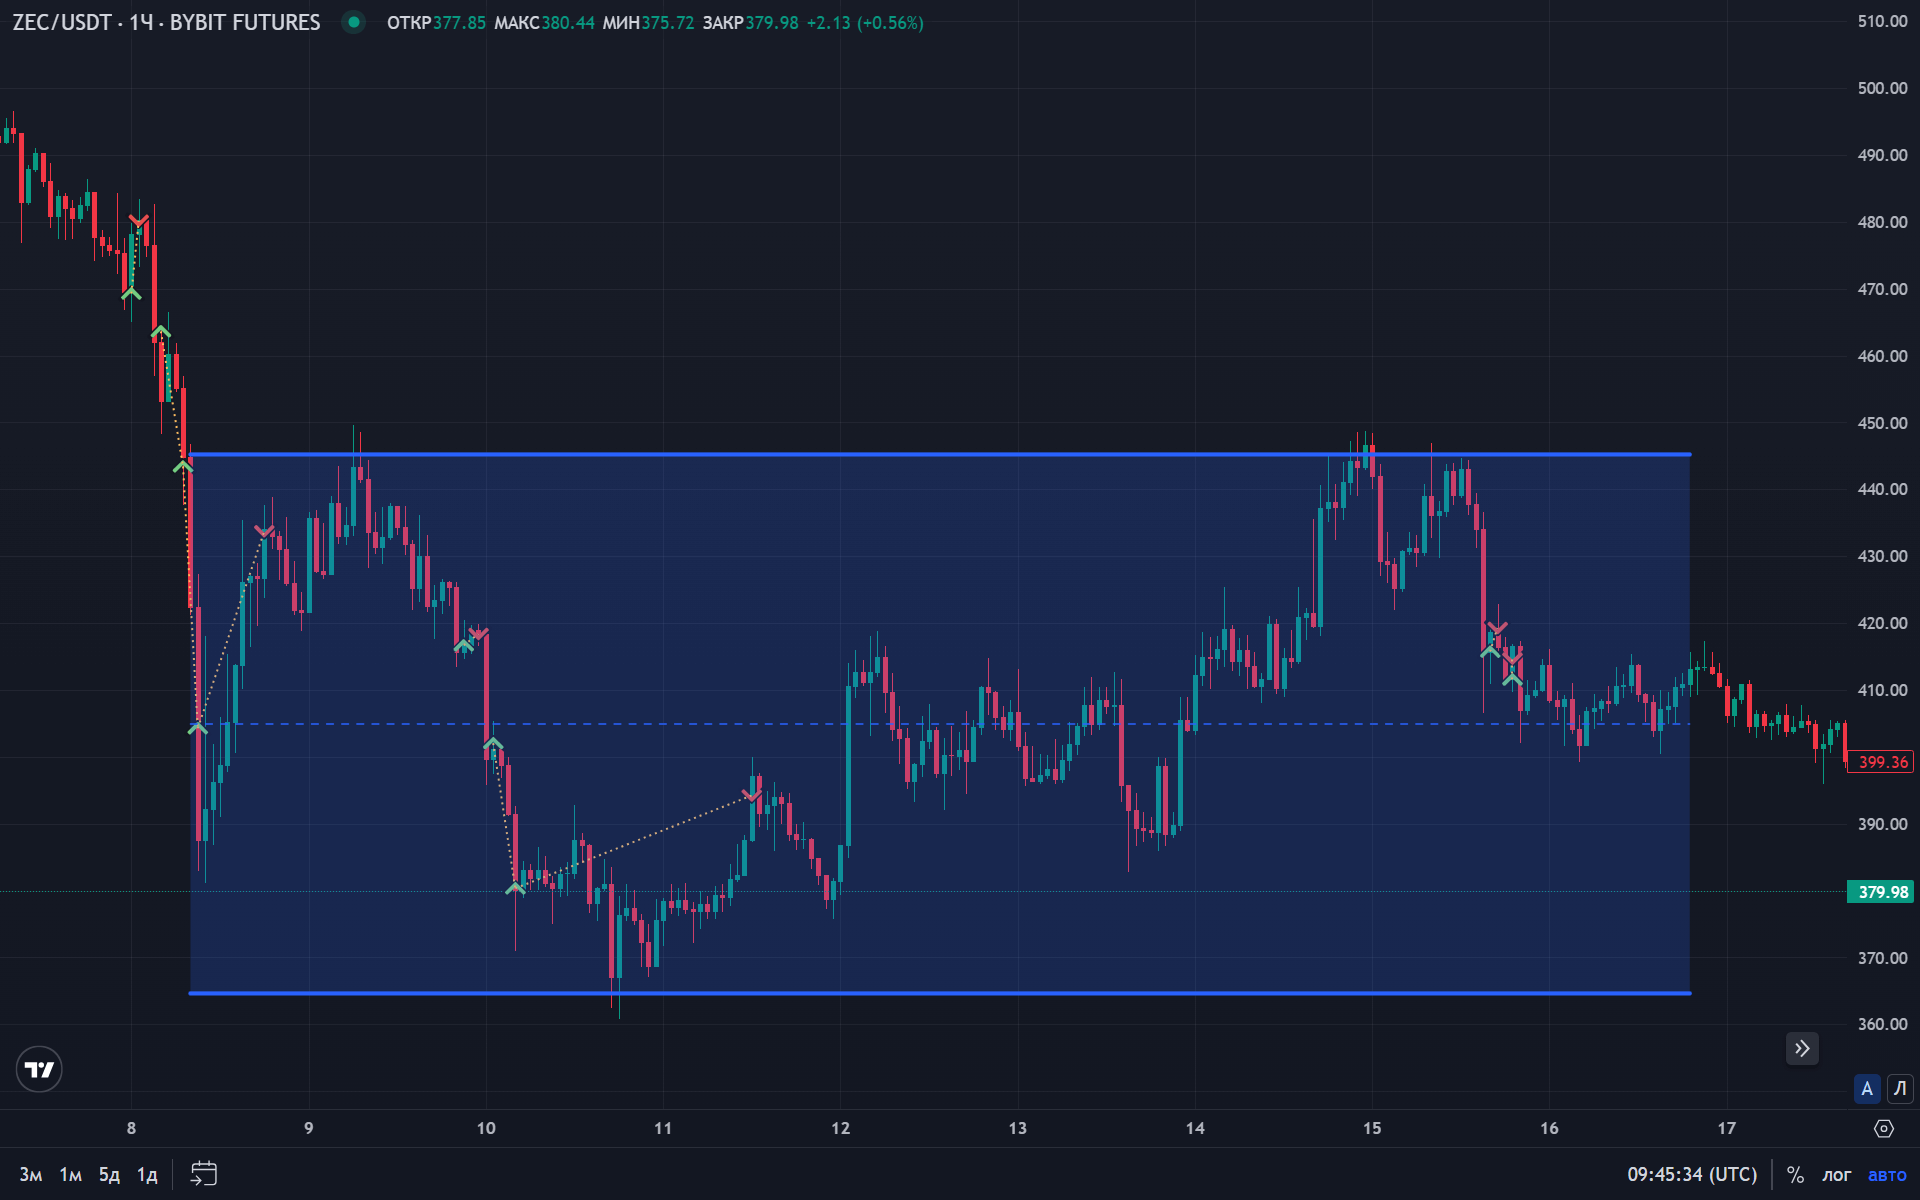
A sideways trend (range) is a consolidation phase where price moves between horizontal support and resistance levels without a clear directional bias.
Typical characteristics
- price bounces between two horizontal levels
- no clean sequence of higher highs / lower lows
- volume is often reduced
- ranges often precede strong impulsive moves
Why ranges happen
Ranges form when:
- large players build positions (can’t deploy size instantly)
- the market is uncertain about direction
- capital rotates between assets
- participants wait for major news/events
How to identify a sideways trend
Visual signs
- Horizontal levels — repeated reactions at the same support/resistance
- No new extremes — highs/lows stop updating
- Balanced swings — up and down moves look symmetric
Using indicators
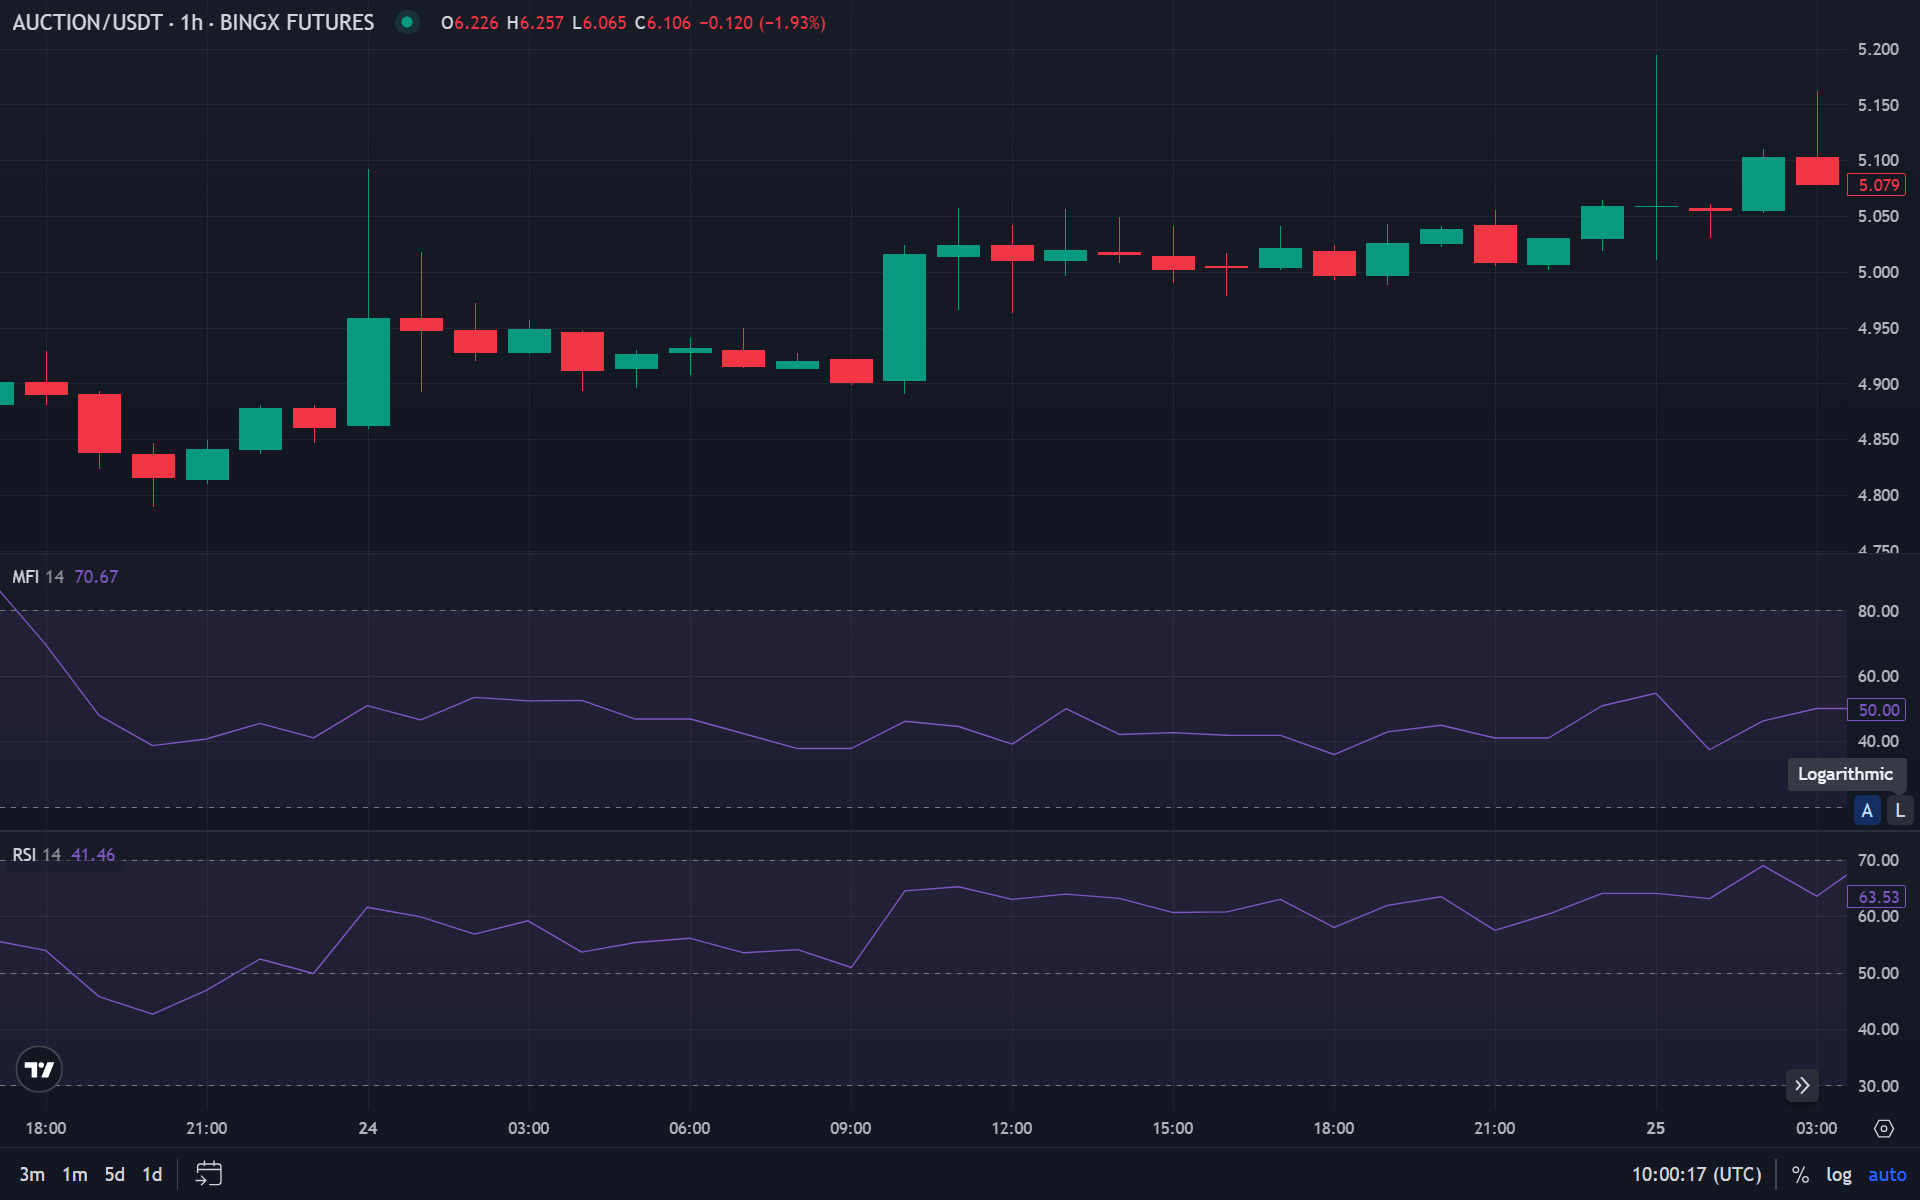
- RSI — in ranges RSI often oscillates around the mid-zone (roughly 40–60)
- MFI — helps assess whether there is real inflow/outflow of capital
- Moving averages — price often “cuts through” MAs without trend-like separation
Strategies for trading sideways markets
Strategy 1: Range trading
Idea: buy near support, sell near resistance.
Rules:
- define range boundaries (support and resistance)
- buy on reactions from the lower boundary
- sell on reactions from the upper boundary
- place a stop beyond the range boundary
- take profit near the opposite boundary
Range trading is simple: look for buys closer to support and sells closer to resistance. To improve entries, add a filter using oscillators (e.g., RSI/MFI) and consider context: if the range starts compressing and looks like accumulation, breakout risk increases — keep position sizing and stops more conservative.
Pros:
- simple logic
- clear entry zones
- easy to automate
Cons:
- breakout risk
- requires accurate boundary selection
Strategy 2: Grid trading
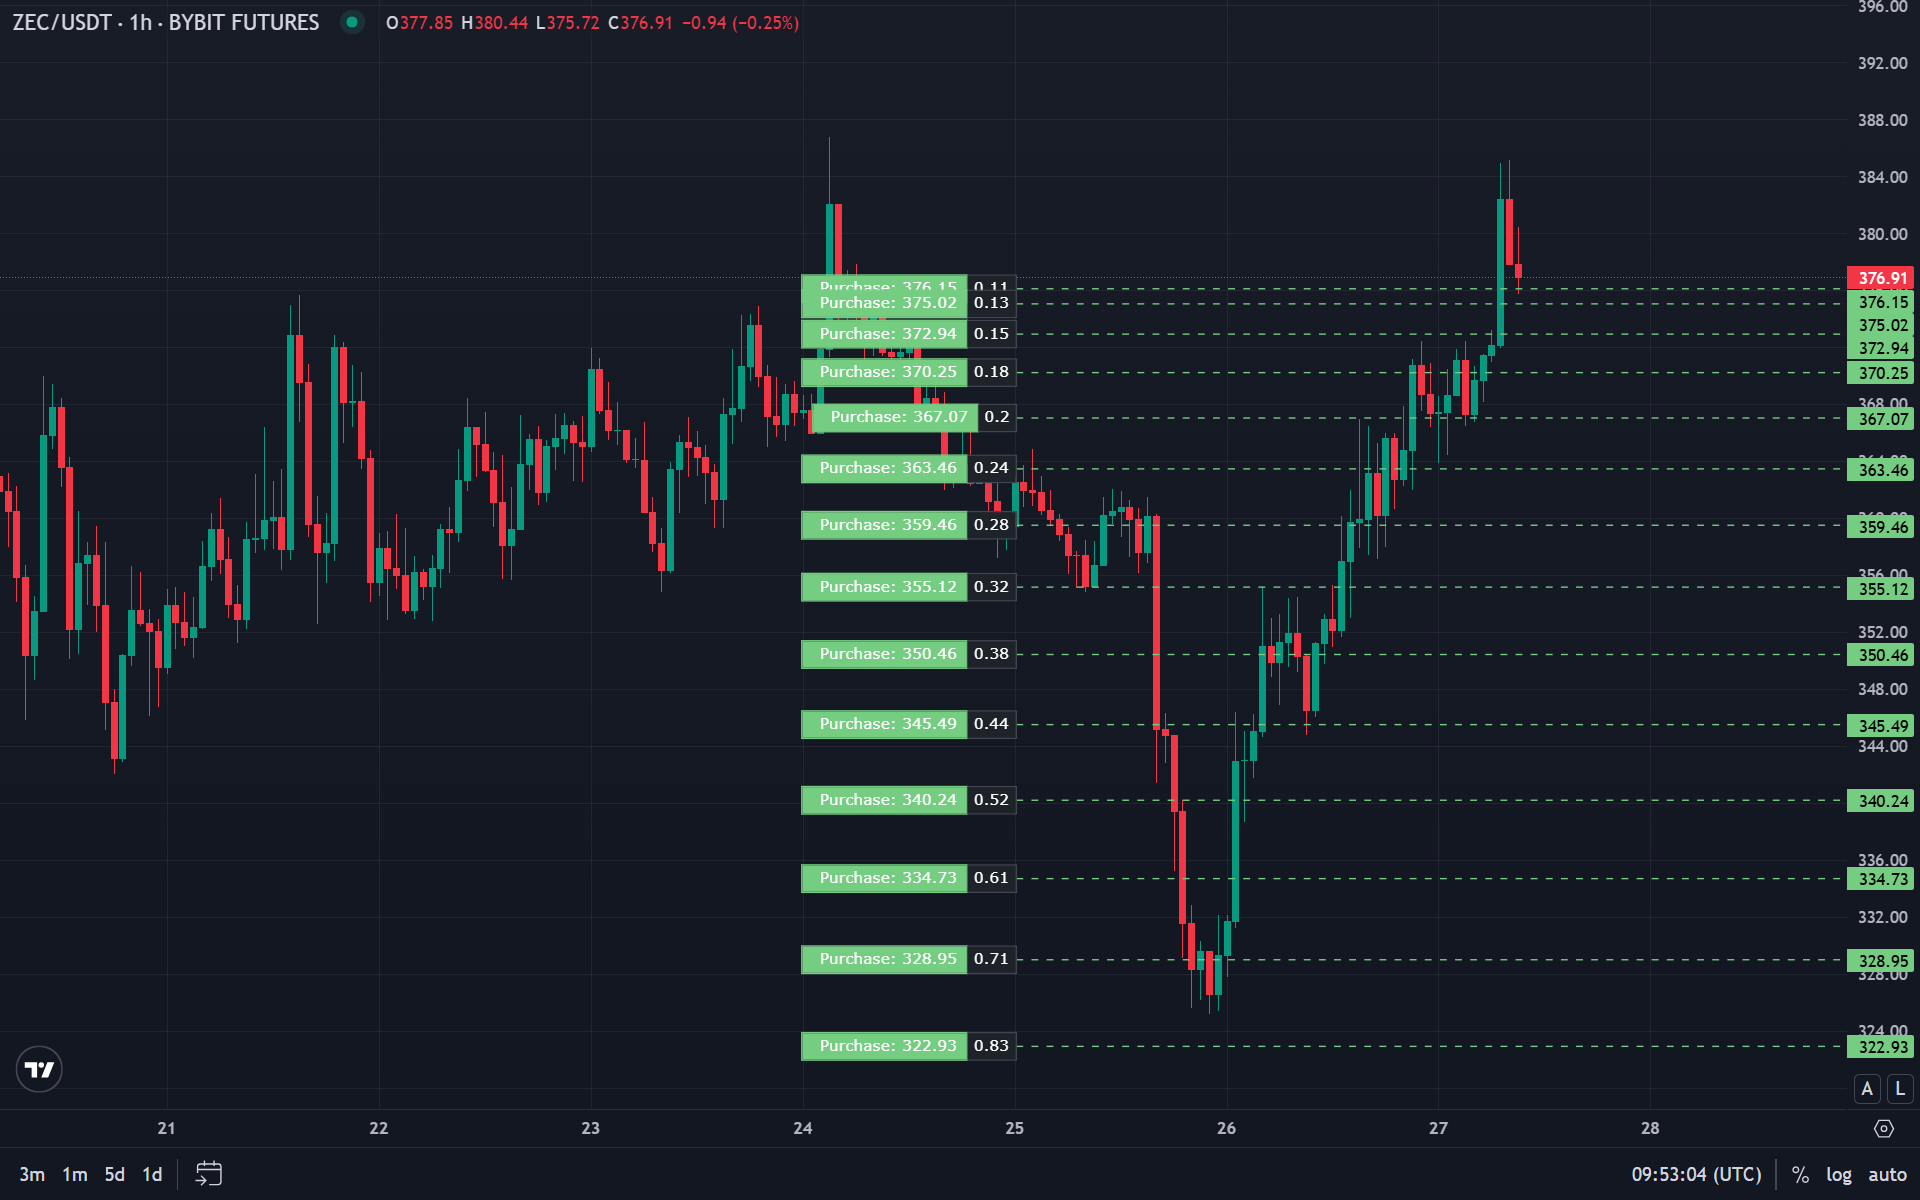
Idea: place a grid of buy and sell orders inside the range.
Rules:
- define the range
- place buy orders with a fixed step (e.g., every 1%)
- place sell orders with the same step
- orders trigger automatically as price oscillates
- profit is captured on each completed cycle
Pros:
- mostly automatic
- captures many small swings
- fits bots well
Cons:
- strong breakout can damage the grid
- needs enough capital for the order ladder
Strategy 3: Oscillator signals
Idea: use oscillators to time mean-reversion inside the range.
Rules:
-
buy when RSI < 30 (oversold) and price is near support
-
sell when RSI > 70 (overbought) and price is near resistance
-
place a stop beyond the range boundary
Pros:
- more objective signals
- works in many types of ranges
- can be combined with other range setups
Cons:
- false signals happen
- better with additional confirmation
Strategy 4: Trading false breakouts
Idea: use fake-outs beyond the range boundary as entries back into the range.
Rules:
- wait for a breakout attempt
- if it fails and price returns — enter against the breakout direction
- stop beyond the fake-out extreme
- target the opposite range boundary
Read more in False Breakouts in Trading.
Risk management in sideways markets
Core rules
- Stop-loss is mandatory — always place stops beyond the range
- Cap risk per trade — set a max loss per idea and stick to it (many suggest 1–2% of account; with diversification the approach can differ — see risk management)
- Position sizing — consider range width when sizing
- Diversify — don’t lock all capital into one range setup
For a deeper framework, see Risk Management in Crypto Trading with Bots .
When the range ends
Signs the range is breaking
-
Breakout with volume
-
Acceptance beyond the boundary (closes hold outside)
-
New highs/lows start printing
-
Structure change — movement becomes directional
What to do after a breakout
If the breakout is confirmed:
- close range-based positions
- don’t fade a strong, accepted breakout
- wait for the next structure / trend setup
Common mistakes
1) Fading a confirmed breakout
If the breakout is confirmed with volume and acceptance, fading it is usually a losing idea.
2) Ignoring stops
A range can break violently. Stops are crucial.
3) Trading without clear boundaries
If your boundaries are vague, entries become random and risk increases.
4) Overtrading
In ranges you don’t need many positions — quality beats quantity.
Algorithmic trading
Sideways markets are great for automation:
- grid bots
- range bots
- oscillator-based bots (RSI/MFI)
Before going live, validate the approach with backtesting.
FAQ
How long can a sideways trend last?
From days to months — depends on the timeframe and market conditions.
Do trend-following strategies work in ranges?
Usually not. Range-specific logic is more appropriate.
Which indicators work best in ranges?
Oscillators like RSI, MFI, and Williams %R tend to be more helpful than trend indicators.
What if the range breaks?
If the breakout is confirmed, close range positions and wait for a new trend structure.
Can range trading be automated?
Yes — ranges are well-suited for bots (grid/range systems).
Bottom line: Sideways markets are normal — and tradable — if you define boundaries well, choose the right strategy (range or grid), and manage risk. Always validate via backtesting.
Summary
Sideways markets are a normal state of the market that can be effectively used for trading. It is important to correctly define the range boundaries, use appropriate strategies (range trading, grid trading), and always apply risk management. To increase reliability, it is recommended to test strategies through backtesting and combine with technical analysis indicators.
For automated grid and range trading, register on Bybit.
Disclaimer
This blog is for informational purposes only. It does not constitute financial or investment advice.
Trading cryptocurrencies and other financial instruments involves high risk. You may lose all your funds.
The author is not responsible for any financial losses resulting from the use of information from this blog.