The RSI (Relative Strength Index) indicator is one of the most popular oscillators in technical analysis. It measures the speed and change of price movements, helping traders determine entry and exit points from the market.
The indicator oscillates in a range from 0 to 100 and is traditionally used to identify overbought or oversold conditions of an asset. RSI is considered a classic technical analysis tool that is applied across various markets, including cryptocurrencies.
What is RSI (Relative Strength Index)
RSI (Relative Strength Index) is a technical oscillator developed by Welles Wilder in 1978. The indicator measures the relative strength of upward and downward price movements over a certain period.
The main idea of RSI is to compare the average price increase with the average price decrease over the selected period. The result is expressed as a number from 0 to 100, making it easy to interpret market conditions.
RSI belongs to the category of momentum indicators. It shows the strength and speed of price movements, helping to determine when an asset may be overbought or oversold. This makes it particularly useful for finding trend reversal points.
History
The RSI indicator was introduced by Welles Wilder in his book “New Concepts in Technical Trading Systems,” published in 1978. Wilder developed several well-known technical indicators, including Average True Range (ATR) and Average Directional Index (ADX).
Initially, RSI was intended for analyzing commodity markets, but over time it began to be applied to all types of financial markets. Thanks to its simplicity of interpretation and effectiveness, the indicator gained popularity among traders worldwide.
Today, RSI is part of the standard toolkit of most trading platforms and is widely used by both beginners and professional traders.
Key Characteristics
RSI has several important properties that make it a universal tool:
Value Range: The indicator is always in a range from 0 to 100, simplifying result interpretation.
Standard Levels: Traditionally, levels 70 and 30 are considered overbought and oversold zones, respectively. However, these values can vary depending on market volatility.
Calculation Period: A period of 14 candles is used by default, but traders can change this parameter to adapt to different timeframes.
Momentum Indicator: RSI reacts to changes in price momentum, allowing potential reversals to be identified earlier than they become obvious on the price chart.
How RSI is Calculated
RSI calculation is based on comparing average values of price increases and decreases over the selected period. The formula includes several steps:
Step 1: Calculate the average price increase (Average Gain) over the period.
Step 2: Calculate the average price decrease (Average Loss) over the period.
Step 3: Calculate relative strength (RS) as the ratio of average gain to average loss.
Step 4: RSI is calculated using the formula: RSI = 100 - (100 / (1 + RS)).
The standard calculation period is 14 candles, but traders can use other values. Short periods (e.g., 9) make the indicator more sensitive, while long periods (e.g., 21) make it smoother.
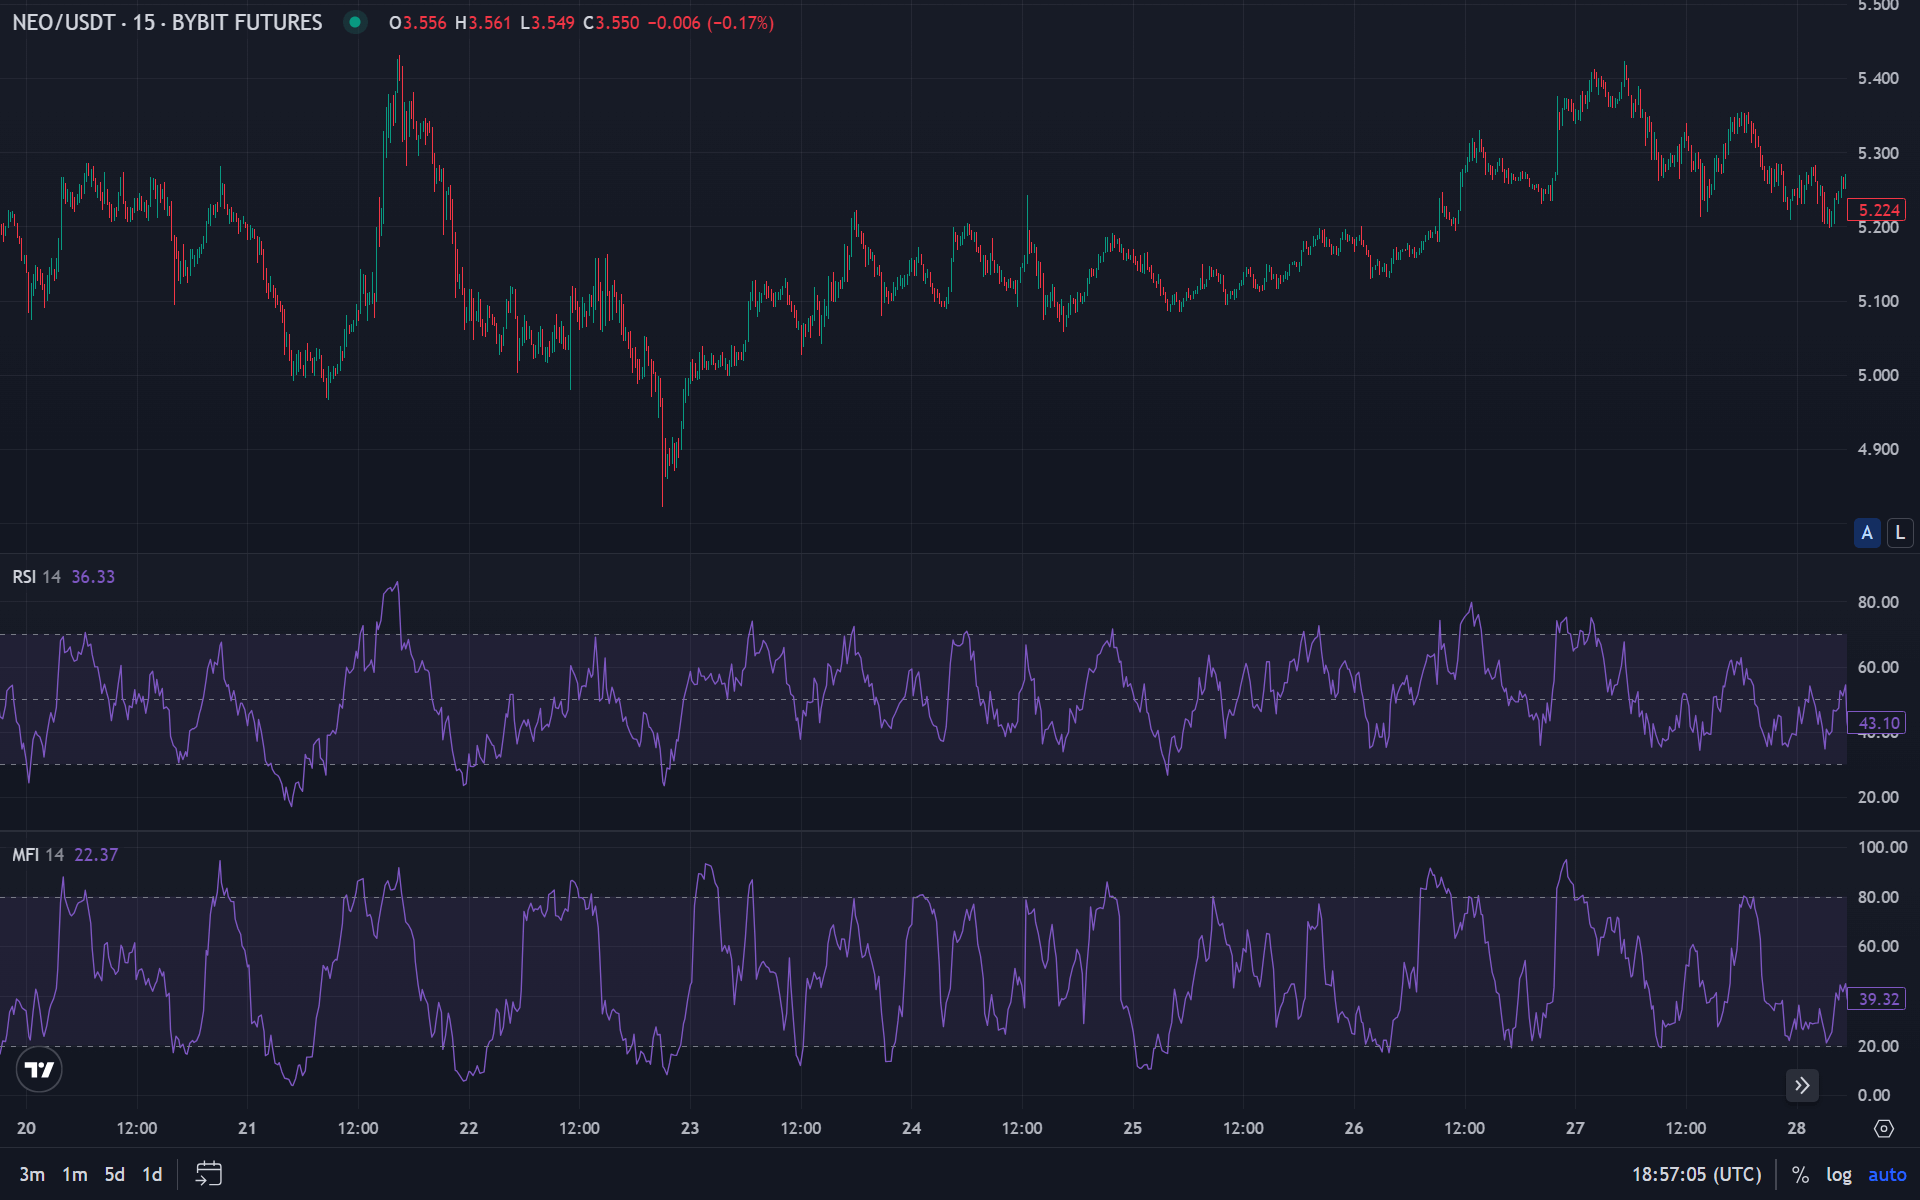
It is important to understand that RSI is calculated only based on candle closing prices. Trading volumes are not considered, unlike the Money Flow Index (MFI), which includes volumes in its calculations.
How to Interpret RSI Values
RSI interpretation is based on analyzing the numerical values of the indicator and their dynamics. Main zones and signals:
Overbought Zone (70-100): Values above 70 traditionally indicate that an asset may be overbought. This means the price increase was too rapid and a downward correction is possible.
However, on strong uptrends, RSI can remain above 70 for extended periods. In such cases, crossing the 70 level from above downward may be a more reliable signal than simply being in the overbought zone.
Oversold Zone (0-30): Values below 30 indicate oversold conditions of an asset. The price decline was too intense, and an upward bounce is possible.
Similarly to the overbought zone, on strong downtrends, RSI can remain below 30 for extended periods. Exiting the oversold zone (crossing the 30 level from below upward) often serves as a more reliable signal.
Neutral Zone (30-70): Values between 30 and 70 are considered normal. RSI being in this zone does not provide clear signals about market conditions.
The centerline (50) plays a special role. RSI crossing the 50 level from below upward may indicate strengthening bullish momentum, while crossing from above downward indicates strengthening bearish momentum.
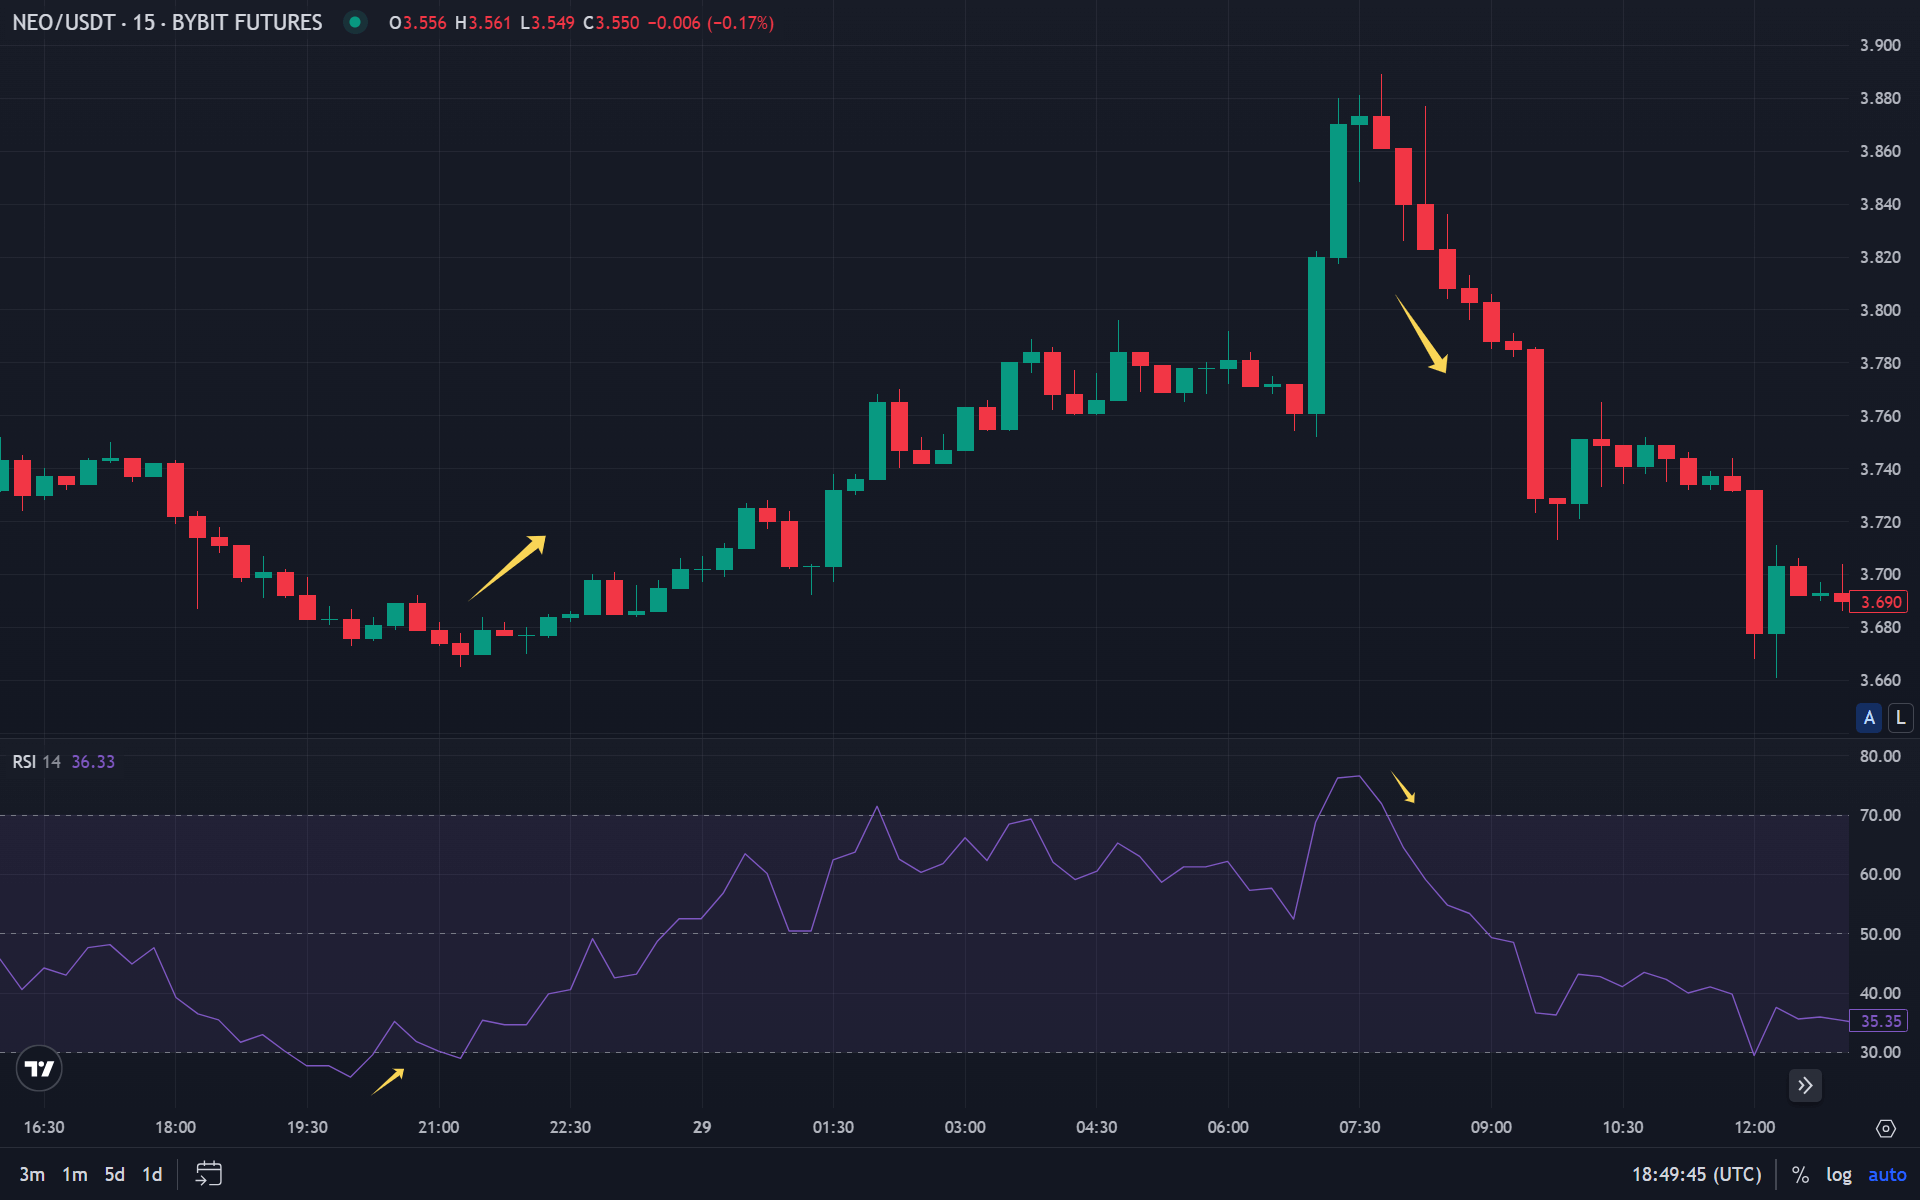
RSI Divergences
Divergence is one of the strongest RSI signals. It occurs when the direction of price movement does not match the direction of indicator movement.
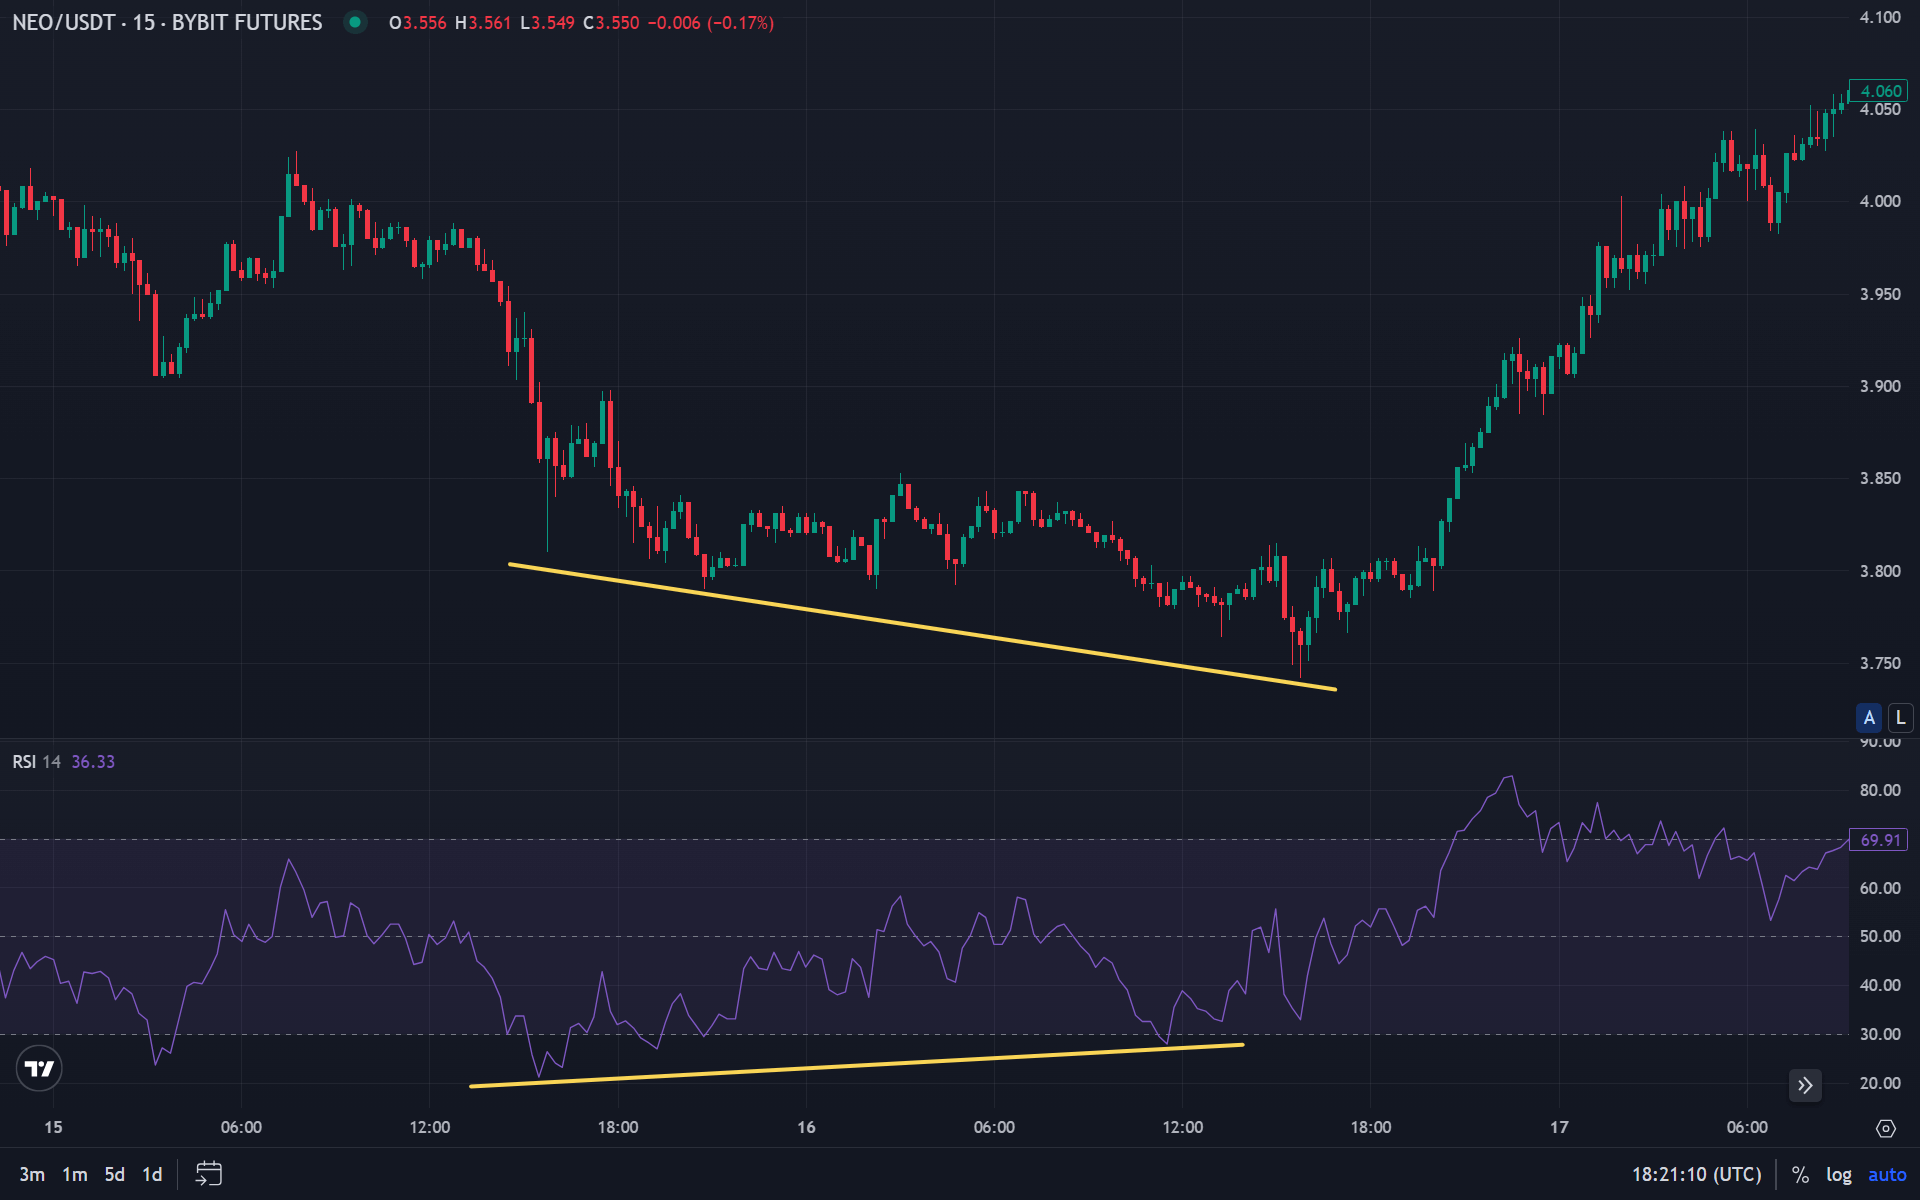
Bullish Divergence: Price forms a new low, while RSI shows a higher low. This indicates weakening bearish momentum and a possible upward reversal.
Bullish divergence is considered a buy signal, especially if it forms in the oversold zone. The larger the time interval between price lows, the stronger the signal.
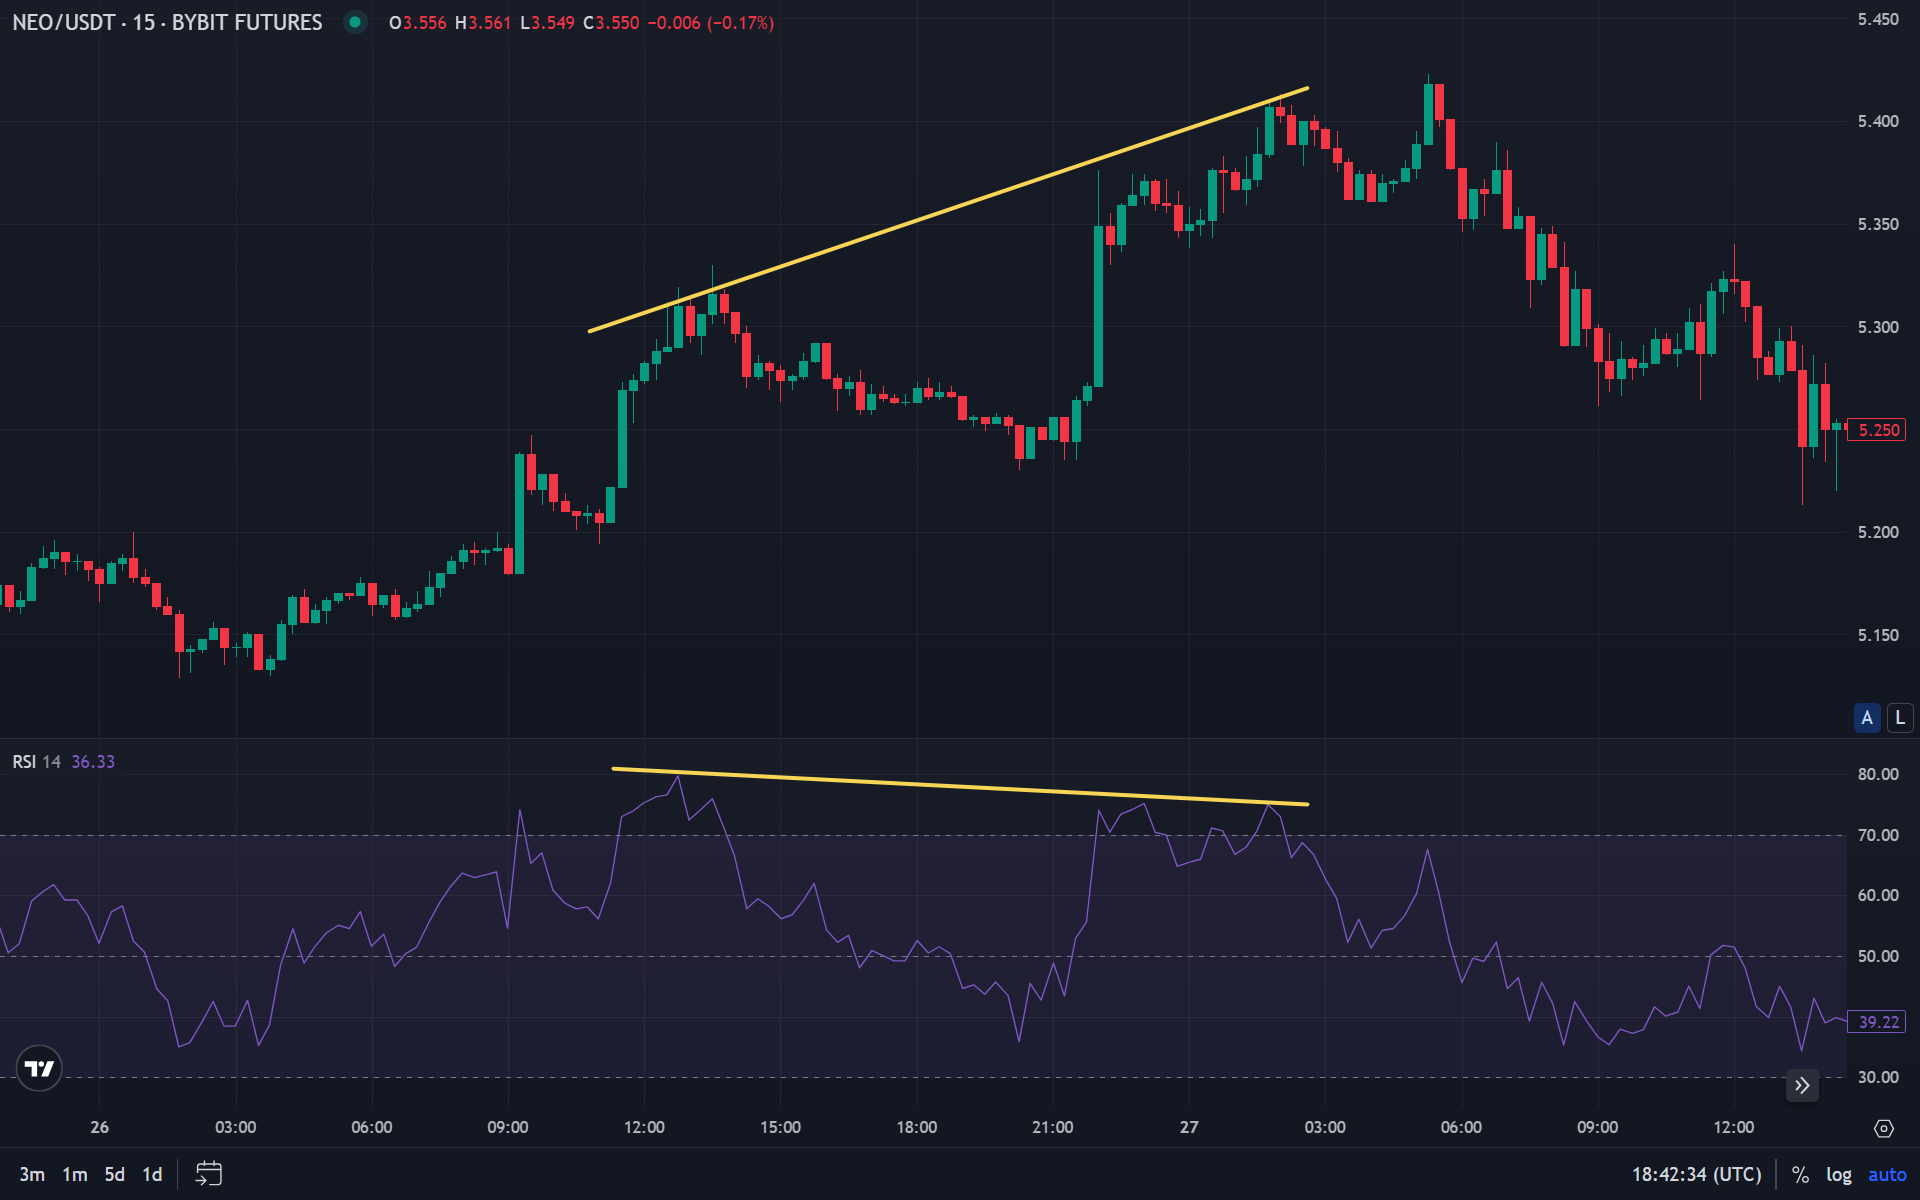
Bearish Divergence: Price forms a new high, while RSI shows a lower high. This indicates weakening bullish momentum and a possible downward reversal.
Bearish divergence is considered a sell signal, especially if it forms in the overbought zone. Like bullish divergence, bearish divergence becomes stronger with increasing time intervals between highs.
RSI divergences are particularly effective in the cryptocurrency market, where volatility allows such patterns to be clearly seen. However, it is important to confirm divergence signals with other indicators, support/resistance levels, or candlestick patterns, such as doji or engulfing patterns.
Using RSI in Cryptocurrency Trading
The cryptocurrency market is characterized by high volatility and specific characteristics, requiring adaptation of classical indicators. RSI is successfully applied in the cryptocurrency market, but with some features.
Cryptocurrency Volatility: High volatility can lead to frequent false RSI signals. In crypto trading, a more sensitive period (9 instead of 14) is often used, or overbought/oversold levels are changed (e.g., 80/20 instead of 70/30).
Different Timeframes: On short timeframes (minutes, hours), RSI can generate many signals, but their reliability is lower. On daily and weekly charts, RSI signals are more significant but occur less frequently.
Trending and Sideways Markets: In sideways trends, RSI effectively shows overbought and oversold conditions. In strong trends, the indicator can remain in extreme zones for extended periods, requiring additional signal filtering.
Signal Confirmation: In the cryptocurrency market, it is especially important to confirm RSI signals with other indicators. For example, combining RSI with the Money Flow Index (MFI) can increase the reliability of trading signals, as MFI accounts for trading volumes.
How to Use RSI in Trading Strategies
RSI can be applied in various trading strategies, from scalping to long-term investments. Before applying an RSI strategy, it is recommended to conduct backtesting to evaluate effectiveness on historical data. Main approaches:
Level Bounce Strategy: Enter a position when RSI reaches extreme zones (below 30 or above 70) with expectation of return to average values. Stop-loss is set beyond the opposite extreme.
This strategy works well in sideways trends but can be dangerous in strong trending movements. It is important to consider the overall market direction before using this strategy.
Divergence Strategy: Enter a position when divergence forms between price and RSI. Bullish divergence is a buy signal, bearish is a sell signal.
The divergence strategy requires skills in visual chart analysis and confirmation with other technical analysis tools. Not all divergences lead to reversals, so it is important to use filters.
50 Level Crossover Strategy: Enter a position when RSI crosses the 50 level in the trend direction. Crossing from below upward on a rising market is a buy signal, crossing from above downward on a falling market is a sell signal.
This strategy is particularly effective for confirming trend strength. Combined with trend indicators, it can provide quality signals.
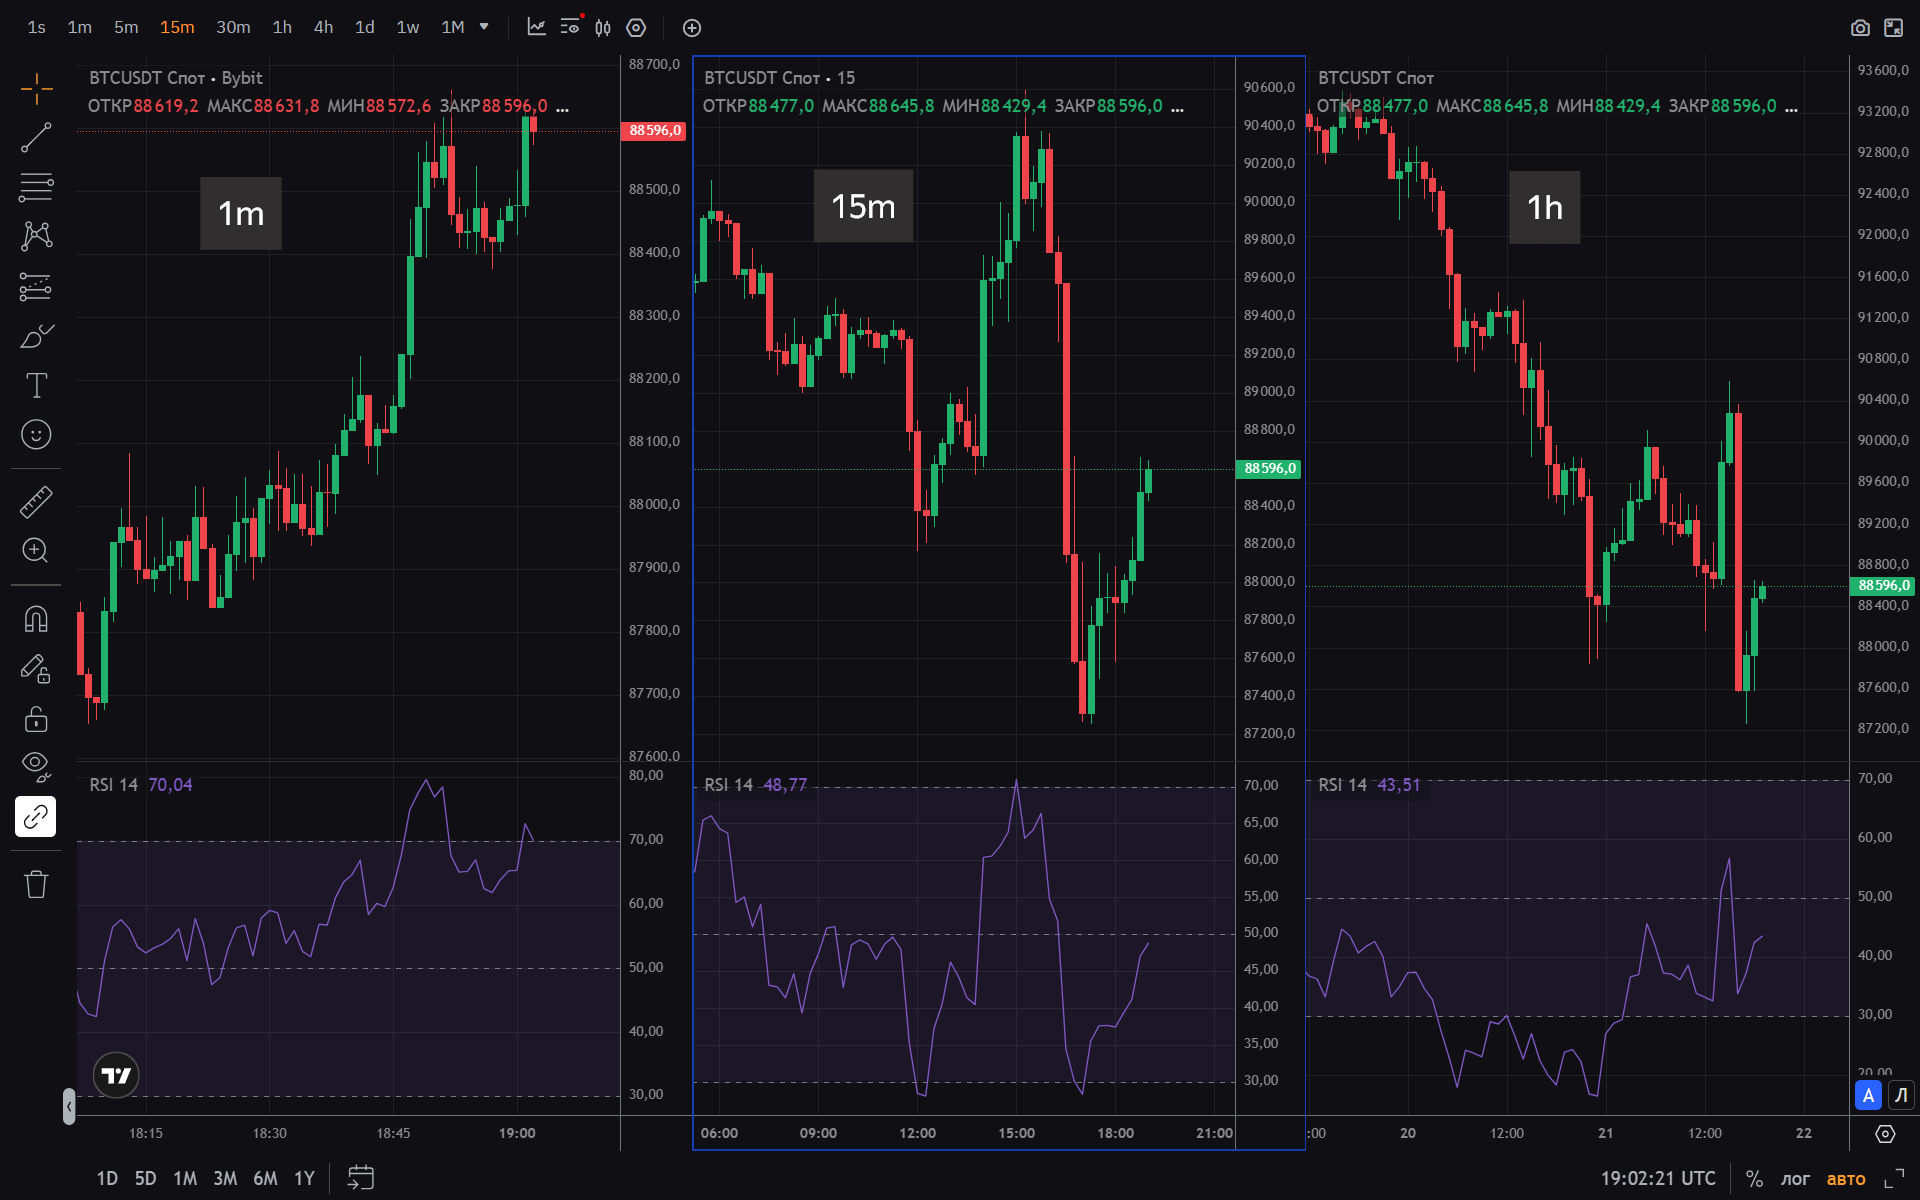
Multi-Timeframe Strategy: Using RSI on different timeframes to confirm signals. For example, if RSI on a daily chart shows oversold conditions, and on an hourly chart a bullish divergence is forming, this strengthens the buy signal.
Multi-timeframe analysis increases the reliability of trading decisions and helps avoid false signals characteristic of short timeframes.
Advantages and Disadvantages of RSI
Like any technical indicator, RSI has its strengths and weaknesses.
Advantages
Simple Interpretation: A value range from 0 to 100 and clear overbought/oversold levels make RSI understandable even for beginner traders.
Versatility: RSI works on all types of markets and timeframes, from cryptocurrencies to traditional financial instruments.
Early Reversal Detection: RSI divergences often appear earlier than reversals become obvious on the price chart.
Wide Availability: The indicator is present on all popular trading platforms and requires no additional configuration.
A similar indicator is Williams Percent Range, which also measures price momentum and can be used in combination with RSI to increase signal reliability.
Disadvantages
False Signals: In trending markets, RSI can remain in extreme zones for extended periods, generating false reversal signals.
No Volume Consideration: RSI is calculated only based on price and does not account for trading volumes, unlike the Money Flow Index (MFI).
Lagging: Like most oscillators, RSI can lag with signals in rapidly changing markets.
Filtering Required: To increase reliability, combining RSI with other indicators or analysis methods is required.
FAQ
What is RSI in simple terms?
RSI is an indicator that shows how fast and strongly an asset’s price moves. Values above 70 indicate possible overbought conditions, while values below 30 indicate oversold conditions.
What RSI value is considered optimal?
There are no optimal values. RSI is interpreted depending on market conditions. In sideways trends, zones 30 and 70 can serve as entry points; in trending markets, the dynamics of RSI changes are more important.
Is RSI better than MFI?
Not better or worse—they are different tools. RSI analyzes only price, while MFI accounts for trading volumes. Both indicators can complement each other in comprehensive analysis. A similar oscillator is also Williams Percent Range, which operates in an inverted range.
How often does RSI give false signals?
The frequency of false signals depends on market conditions and indicator settings. In sideways trends, RSI is more reliable; in strong trends, it can generate many false signals. Combining with other indicators reduces the number of false triggers.
On which timeframe is it better to use RSI?
RSI works on all timeframes. For short-term trading, short periods (9) are used; for long-term trading, standard (14) or longer (21) periods are used. It is important to consider that on short timeframes there are more signals, but their reliability is lower.
What is RSI divergence?
Divergence is a discrepancy between the direction of price movement and RSI. Bullish divergence (price falls, RSI rises) may indicate an upward reversal; bearish divergence (price rises, RSI falls) may indicate a downward reversal.
Can RSI be used alone?
Technically yes, but in practice RSI is more reliable in combination with other technical analysis tools. Confirming signals with support/resistance levels or other indicators increases the probability of successful trades.
Summary
RSI is one of the most reliable technical analysis indicators, proven by decades of practice. The indicator makes it possible to effectively identify overbought and oversold zones, as well as detect divergences earlier than they become obvious on the price chart. Maximum efficiency is achieved by combining with other analysis tools: Williams %R, MFI, and volume analysis. For automated RSI strategies, traders often use platforms like Veles — a popular service for running trading bots.
Disclaimer
This blog is for informational purposes only. It does not constitute financial or investment advice.
Trading cryptocurrencies and other financial instruments involves high risk. You may lose all your funds.
The author is not responsible for any financial losses resulting from the use of information from this blog.