Rising Wedge in Trading: What It Is and How to Use It
In technical analysis, the rising wedge is one of the main bearish patterns that can signal a potential reversal of an uptrend. Understanding it and using it correctly can improve both discretionary and algorithmic trading.
Definition and Visual Traits
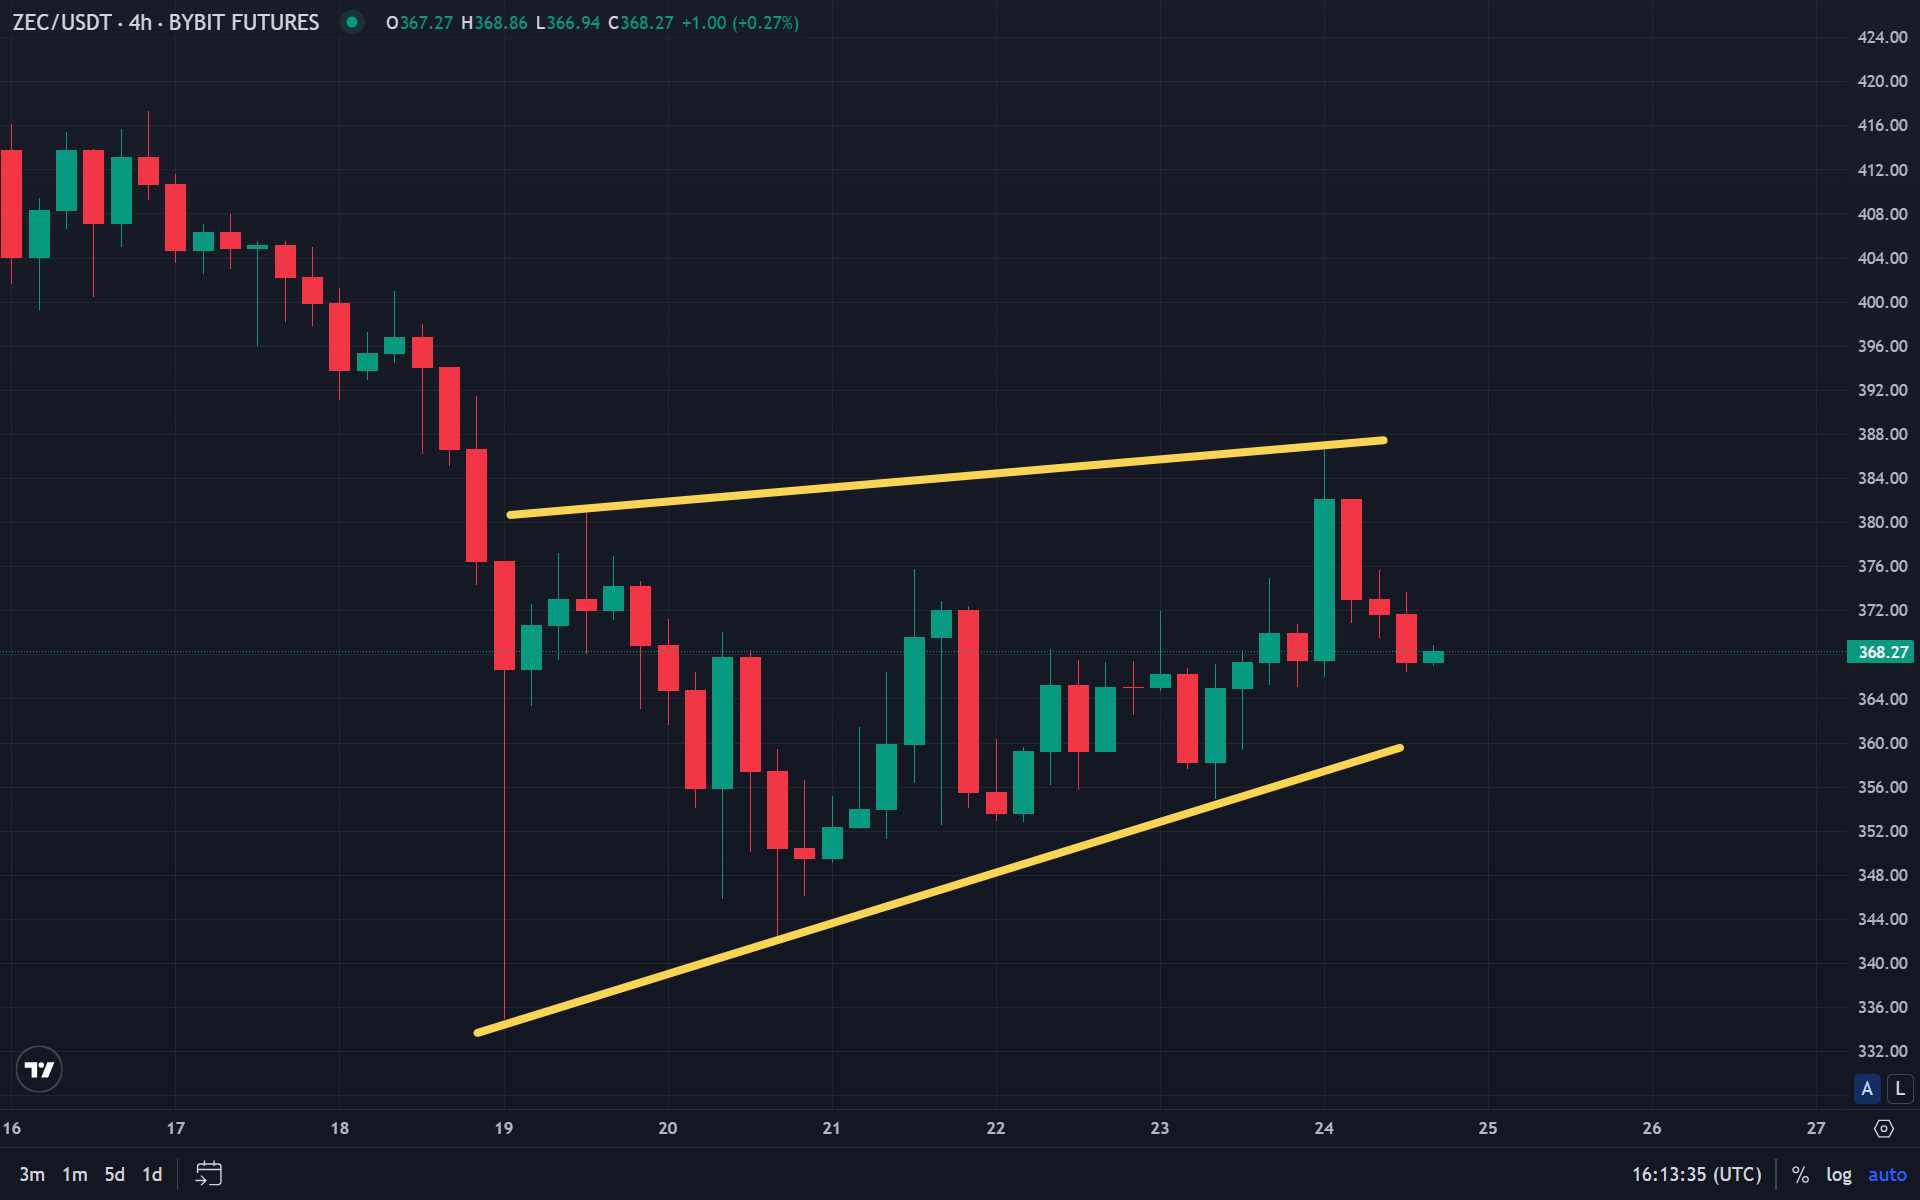
A rising wedge is a chart pattern formed by two converging trendlines, both sloping up. The support line (lower boundary) has a steeper slope than the resistance line (upper boundary). This indicates slowing upward momentum and possible exhaustion of the bullish move.
Main visual traits:
- Gradual narrowing of the price range.
- A sequence of higher highs and higher lows.
- Declining volume as the pattern develops.
How It Differs From Other Patterns
Unlike a price channel, where support and resistance are parallel, the rising wedge has converging lines. The narrowing suggests lower volatility and a possible trend change. In a channel, price moves within a stable range; in a wedge, upward movement tends to slow.
How a Rising Wedge Forms
It typically appears after a sustained uptrend. As price moves higher, momentum fades, with highs rising more slowly than lows. The range narrows and a wedge-shaped structure forms. Lower volume during this phase supports the idea of weaker buying and a higher chance of a reversal.
Meaning of the Rising Wedge
In technical analysis, patterns imply possible future outcomes. The rising wedge is mostly treated as a bearish signal.
Bearish Signal
The rising wedge is often seen as bearish, especially when it forms after a prolonged uptrend. A break below the lower support line, preferably on higher volume, confirms a reversal and suggests the start of a downtrend. Traders use this to open shorts or take profit on longs.
Trading Examples
On the Spot Market
In crypto spot markets (e.g. BTC/USD), a rising wedge can warn of a correction after a long rally. Traders holding the asset may prepare for a pullback by setting stop-losses or opening shorts after a confirmed break.
On Futures and Leverage
With futures or leverage, the rising wedge becomes even more important. It can be traded for a bounce (long) or a breakout (short). Because of higher risk, recognising the pattern early and adjusting positions (e.g. closing or adding protective orders) helps limit losses.
Rising Wedge and Trading Bots
In volatile crypto markets, bots are increasingly used. Many can detect chart patterns, including the rising wedge, and place trades automatically.
Understanding and using the rising wedge correctly can improve trading results. It can be combined with other tools, such as the RSI or doji candles, for better timing. For volume and momentum analysis, the Money Flow Index (MFI) is useful, and for identifying overbought zones, the Williams %R oscillator can help.
Summary
The rising wedge is a bearish reversal pattern that forms after an uptrend. It shows weakening momentum and often precedes a breakdown. Confirm with volume and combine with other indicators.
For automated pattern trading, register on Bybit.
FAQ
Is a rising wedge bullish or bearish?
Mostly bearish. Signals exhaustion of an uptrend and possible reversal down.
How to identify a rising wedge breakout?
Price breaks below the lower support line. Confirmation comes with volume.
Can you trade a rising wedge long?
Technically yes, but risky. Most trade breakout to the short side.
How does it differ from a price channel?
In a channel, lines are parallel; in a wedge, they converge. Wedge indicates narrowing volatility.
What timeframe is best for this pattern?
H1 and above. Lower timeframes have many false breakouts.
Disclaimer
This blog is for informational purposes only. It does not constitute financial or investment advice.
Trading cryptocurrencies and other financial instruments involves high risk. You may lose all your funds.
The author is not responsible for any financial losses resulting from the use of information from this blog.