Many traders underuse the potential of the Williams %R oscillator. It helps identify trend exhaustion and entry points on reversals.
What is the Williams %R indicator
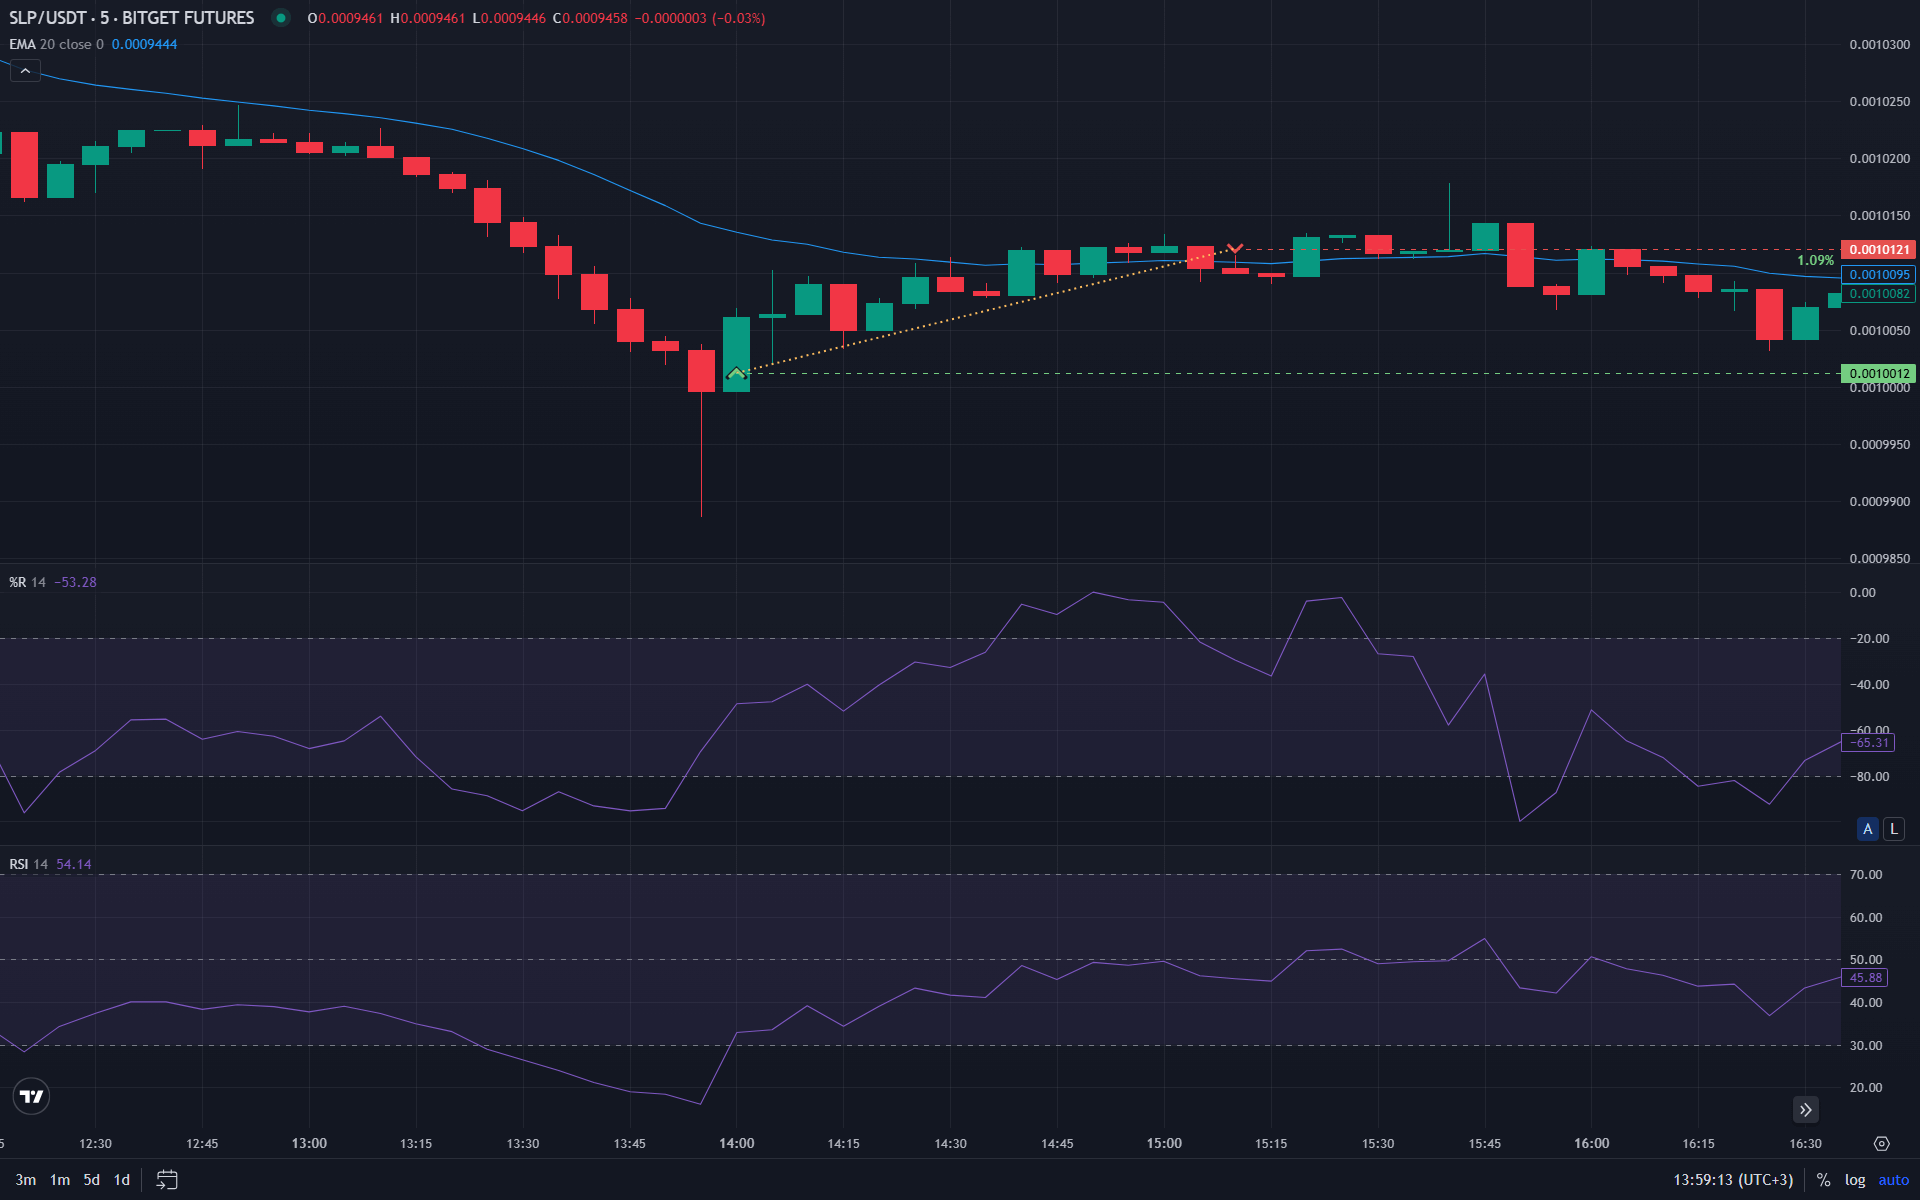
Williams %R is a classic oscillator used to analyze price movement in financial markets. It helps identify overbought and oversold zones and possible reversal points. In cryptocurrency trading it is popular for its sensitivity to fast price changes.
How it works
Williams %R compares the current closing price with the price range over a chosen period. It shows how close the current price is to the high or low of that range.
The indicator assumes that in an uptrend price tends toward the top of the range, and in a downtrend toward the bottom. Values range from 0 to -100:
- Values near 0 indicate overbought conditions.
- Values near -100 indicate oversold conditions.
It is a leading tool: it reacts to price changes faster than many other oscillators, which helps prepare for possible trend reversals in volatile markets.
Williams %R formula
The formula is:
%R = (Highest High - Close) / (Highest High - Lowest Low) × (-100)
This highlights potential reversal points by measuring where price sits within its recent range.
Interpreting the readings
Two levels are commonly used:
- Above -20: market is considered overbought. Price is in the upper part of the range and the risk of a pullback increases.
- Below -80: market is considered oversold. The asset is in the lower part of the range, which often precedes a bounce.
Being in extreme zones is not an automatic trade signal. Many traders wait for the line to leave these zones to confirm a change in momentum.
Buy and sell signals
Williams %R generates signals when leaving extreme zones:
- Buy signal: when the indicator crosses above -80 from below. The asset is starting to recover after heavy selling.
- Sell signal: when the indicator crosses below -20 from above. Buying pressure is fading.
Combining Williams %R with other indicators
Because %R is leading, it can give false signals in strong trends. It is often combined with:
- Williams %R + RSI: filters false signals by comparing two oscillators.
- Williams %R + EMA 50/200: confirms signals in line with the longer-term trend.
- Williams %R + volume indicators: volume spikes on exits from overbought/oversold zones add confidence.
- Williams %R + Bollinger Bands: spots when price is at extreme distance from the average.
- Williams %R + MFI: combines momentum and volume for stronger confirmation.
Who Williams %R is for
It suits short- and medium-term traders (scalping, intraday). It works well in sideways markets and when looking for local pullbacks.
Beginners benefit from its simple interpretation, but need discipline when the market is in a strong directional move.
Summary
Williams %R shows overbought/oversold zones (-20/-80). Use with trend indicators to filter false signals. Works well with RSI and MFI for confirmation. Best suited for short- and medium-term trading in sideways markets.
For automated Williams %R strategies, traders often use platforms like Veles — a popular service for running trading bots.
FAQ
What settings for Williams %R to use?
Default period is 14. For scalping on lower timeframes — 5–10. For swing — 20–28.
Williams %R or RSI — which is better?
RSI is slower and smoother, %R is faster and more sensitive. Use together for confirmation.
Why does the indicator stay long in overbought zone?
In a strong trend this is normal. Uptrend = price at highs = overbought can last long.
How to use with trend indicators?
Only take signals in trend direction. In uptrend — wait for exit from oversold (-80). In downtrend — from overbought (-20).
Does it work on crypto?
Yes, but with caution due to high volatility. Always get confirmation from other indicators.
Disclaimer
This blog is for informational purposes only. It does not constitute financial or investment advice.
Trading cryptocurrencies and other financial instruments involves high risk. You may lose all your funds.
The author is not responsible for any financial losses resulting from the use of information from this blog.