ATR (Average True Range) is a volatility indicator developed by Welles Wilder, who also created RSI. It shows the average “true” range of price over the period — how much price moved from candle to candle. ATR% is ATR expressed as a percentage of the current price; it makes it easy to compare volatility across assets and timeframes. This article covers how ATR and ATR% are calculated, why they are useful for stop-losses and position size, and how to align them with trailing stop and risk management.
What Is ATR (Average True Range)
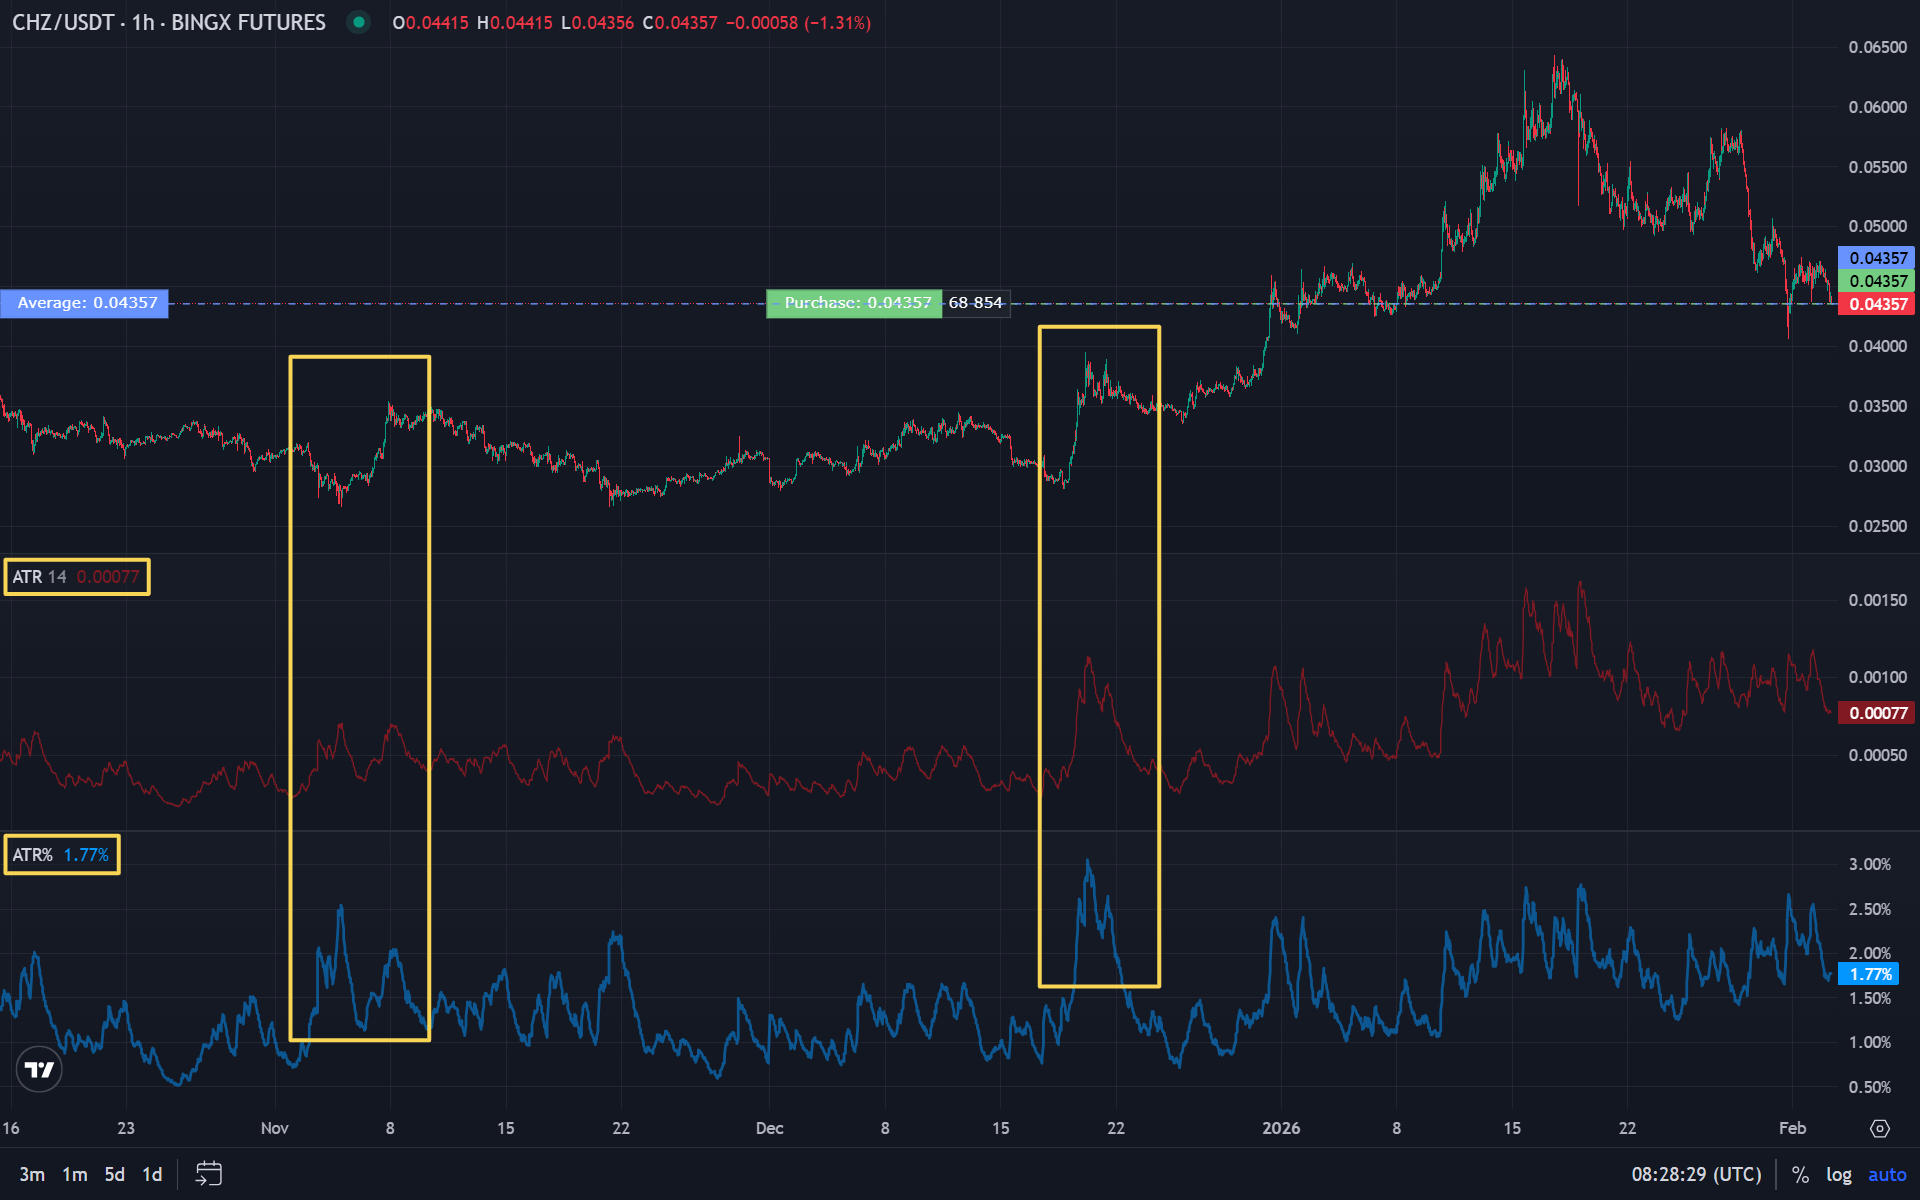
Average True Range (ATR) is an indicator that measures the average “true range” of price over the chosen period. True Range (TR) for each candle takes into account not only the high–low of the current candle but also the gap between the previous close and the current extremes. So ATR reflects volatility correctly when there are gaps and strong moves.
ATR is in the same units as price (dollars, points). The higher ATR, the larger the typical price move over the period — so the stop-loss is usually placed farther from entry to avoid being taken out by random noise. More on using volatility in trading in risk management materials.
What Is ATR%
ATR% is ATR divided by the current price of the asset and multiplied by 100. Formula: ATR% = (ATR / Closing price) × 100. The result is volatility as a percentage of price.
ATR% lets you compare volatility across assets and timeframes. For example, ATR of $1000 on Bitcoin and $10 on an altcoin are not comparable in absolute terms, but ATR% gives a relative measure: how large the typical move is relative to price. This is useful for diversification and position sizing.
How ATR and ATR% Are Calculated
Step 1. True Range (TR) for each candle is the maximum of three values:
- Difference between high and low of the current candle (High − Low).
- Absolute difference between high of the current candle and previous close (|High − Prev Close|).
- Absolute difference between low of the current candle and previous close (|Low − Prev Close|).
For the first candle, TR is usually High − Low.
Step 2. ATR is a smoothing of true range over N periods. Wilder used RMA (a form of exponential); many platforms use EMA or RMA with period 14 by default. So ATR(14) is the averaged TR over 14 candles.
Step 3. ATR% = (ATR / Closing price) × 100. Computed on the current or last closed candle.
The standard ATR period is 14, as with RSI. On different timeframes the same period 14 has different “depth”: on M5 it is about an hour of movement, on D1 about two weeks.
Use: Stop-Losses and Position Size
ATR is widely used to set stop-losses in a reasoned way. The idea: the stop should allow for normal “noise” in the asset, or positions will be stopped out often without a real reversal. Typical approaches:
- Stop-loss at 1.5–2 × ATR from entry. When volatility rises, ATR rises and the stop moves farther automatically; when volatility falls, it moves closer.
- Trailing stop: the stop is moved with price, keeping a distance of e.g. 2 ATR. More in the trailing stop article.
Position size can also be tied to ATR: the higher ATR (or ATR%), the smaller the position size for the same monetary risk. So risk management adapts to current volatility.
ATR and the Crypto Market
Cryptocurrencies are often highly volatile; ATR on crypto pairs can change a lot over time. On low timeframes ATR gives many signals about the “range” of movement — useful for scalping and intraday trading. On daily charts ATR helps estimate the typical daily range and set stops and take-profits for swing.
A fixed stop in points or dollars on one asset can be too tight (frequent stop-outs) or too wide (large losses). ATR and ATR% let you adapt the stop and position size to current market behaviour.
Combining with Other Indicators
ATR does not show direction — only the size of swings. It is used together with trend and momentum tools:
- Trend + ATR: trend is defined by moving averages or chart structure; ATR is used to place the stop-loss and assess “normal” correction size.
- RSI/Williams %R + ATR: oscillators give entry signals; ATR suggests how far to set the stop. More on oscillators in RSI and Williams %R articles.
Summary
- ATR is the average true range of price over the period; it shows volatility in price units. ATR% is ATR as a percentage of price, useful for comparing assets.
- True Range = max(High−Low, |High−PrevClose|, |Low−PrevClose|); ATR is smoothed TR (often period 14).
- ATR is used to set stop-losses (e.g. 1.5–2 × ATR) and trailing stops, and to adapt position size to volatility.
- In crypto, ATR helps adjust stops and risk to a changing market. For automated ATR-based strategies, traders often use platforms like Veles — a popular service for running trading bots.
FAQ
What ATR period should I choose?
Standard is 14. For scalping on low timeframes — 5–7. For swing trading on D1 — 20–28.
Why is ATR% better than plain ATR?
It lets you compare volatility across different assets. ATR $100 on BTC and $5 on ALT — unclear which is more volatile. ATR% shows it immediately.
How to use ATR for trade entry?
ATR doesn’t give entry signals. It’s used for stop-loss placement: higher ATR = wider stop.
Can I use ATR without other indicators?
You can, but it’s not ideal. ATR shows only volatility, not direction. Combine with trend indicators.
How does ATR help with position management?
When volatility rises, ATR rises → stop moves away. When it calms — stop moves closer. This is adaptive risk management.
Disclaimer
This blog is for informational purposes only. It does not constitute financial or investment advice.
Trading cryptocurrencies and other financial instruments involves high risk. You may lose all your funds.
The author is not responsible for any financial losses resulting from the use of information from this blog.